Behaviour Analysis
- 1 Minute to read
- Print
- DarkLight
- PDF
Behaviour Analysis
- 1 Minute to read
- Print
- DarkLight
- PDF
Article summary
Did you find this summary helpful?
Thank you for your feedback!
The behaviour dashboard allows you to review all behaviour data that has been recorded and can also be filtered and exported.
Within the dashboard there are also reports that can be run on key behaviour metrics, allowing you to access powerful insights at the click of a button,
How to review and export behaviour data
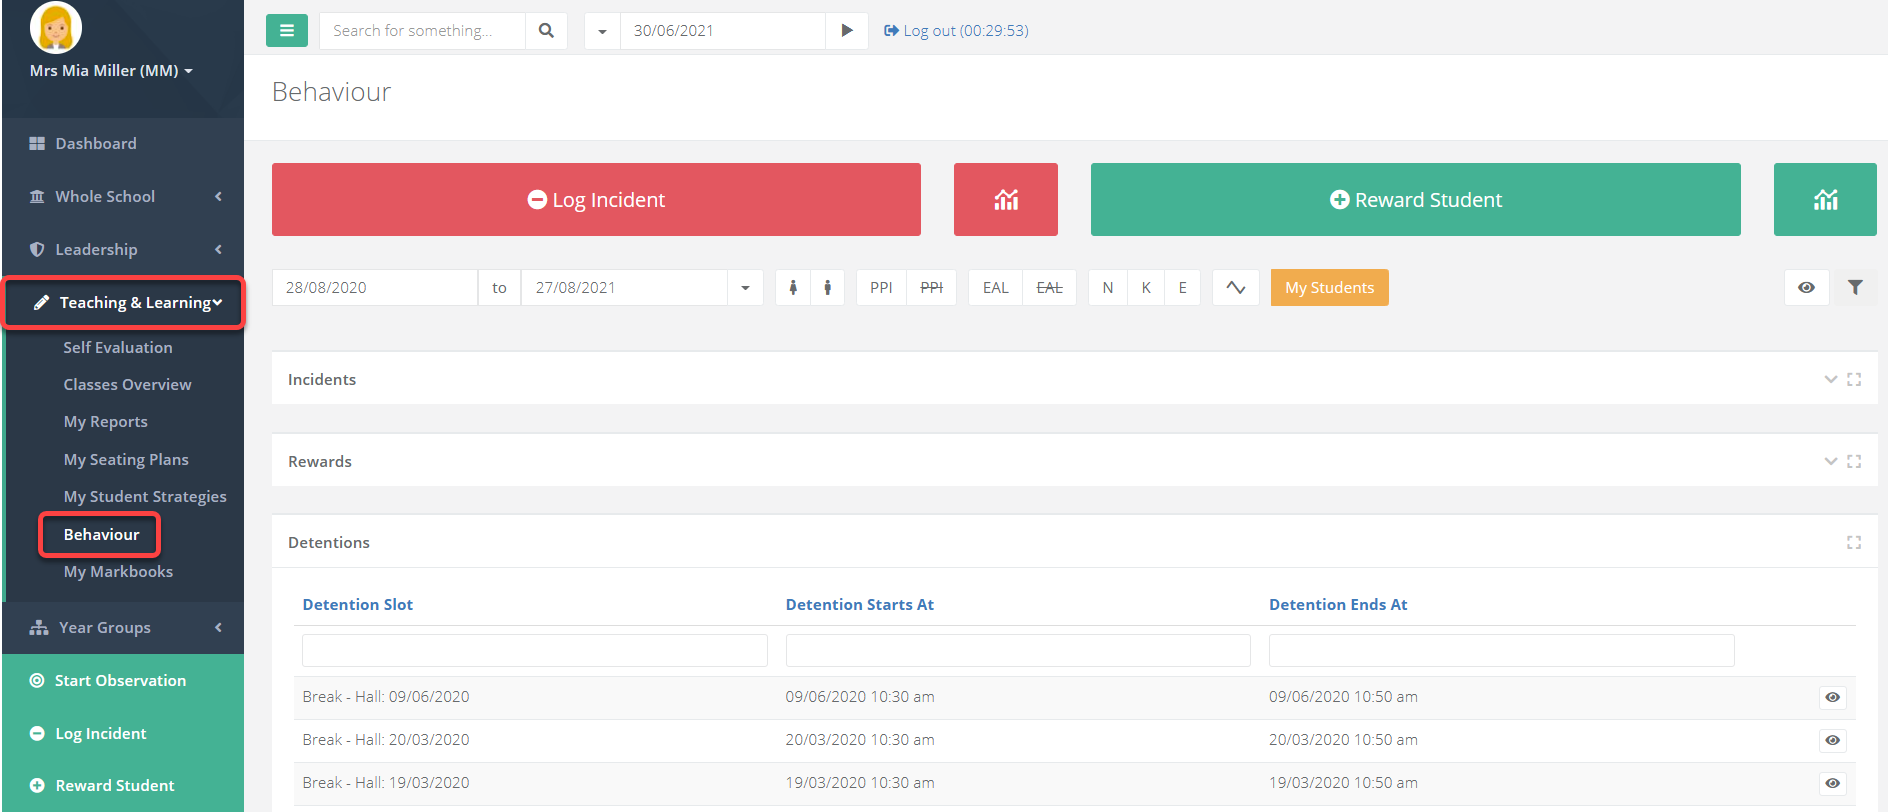
Select Teaching & Learning > Behaviour from the menu to access the behaviour dashboard. Depending on if you want to review the incidents or rewards, select the appropriate heading to expand it.
You will see basic information for each record.
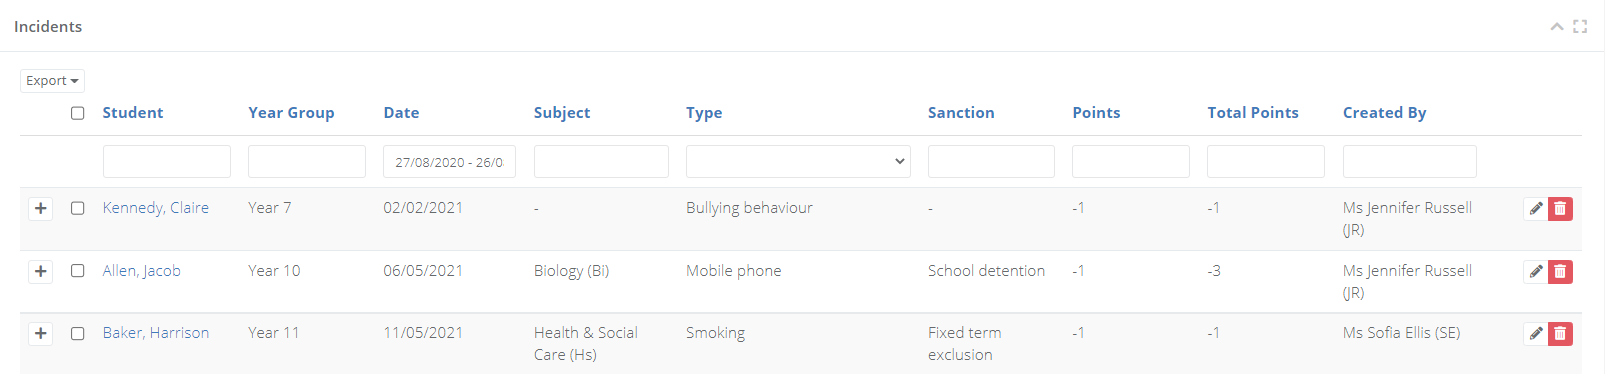
To export the data, select export above the table.
Filtering the data
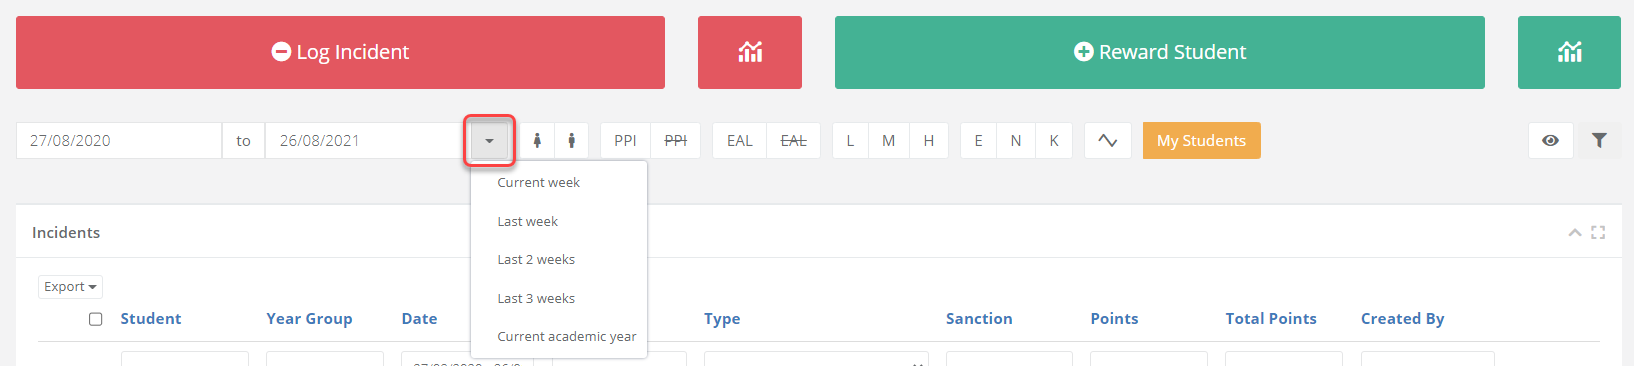
behaviour data loads the current term by default within the date range. You can enter a different range, or select one from a pre-defined list by using the arrow next to the date field.
The eye icon allows you to see and select additional filters.
Once you chosen your filters, select the blue filter icon to refresh the data.
How to access behaviour reports
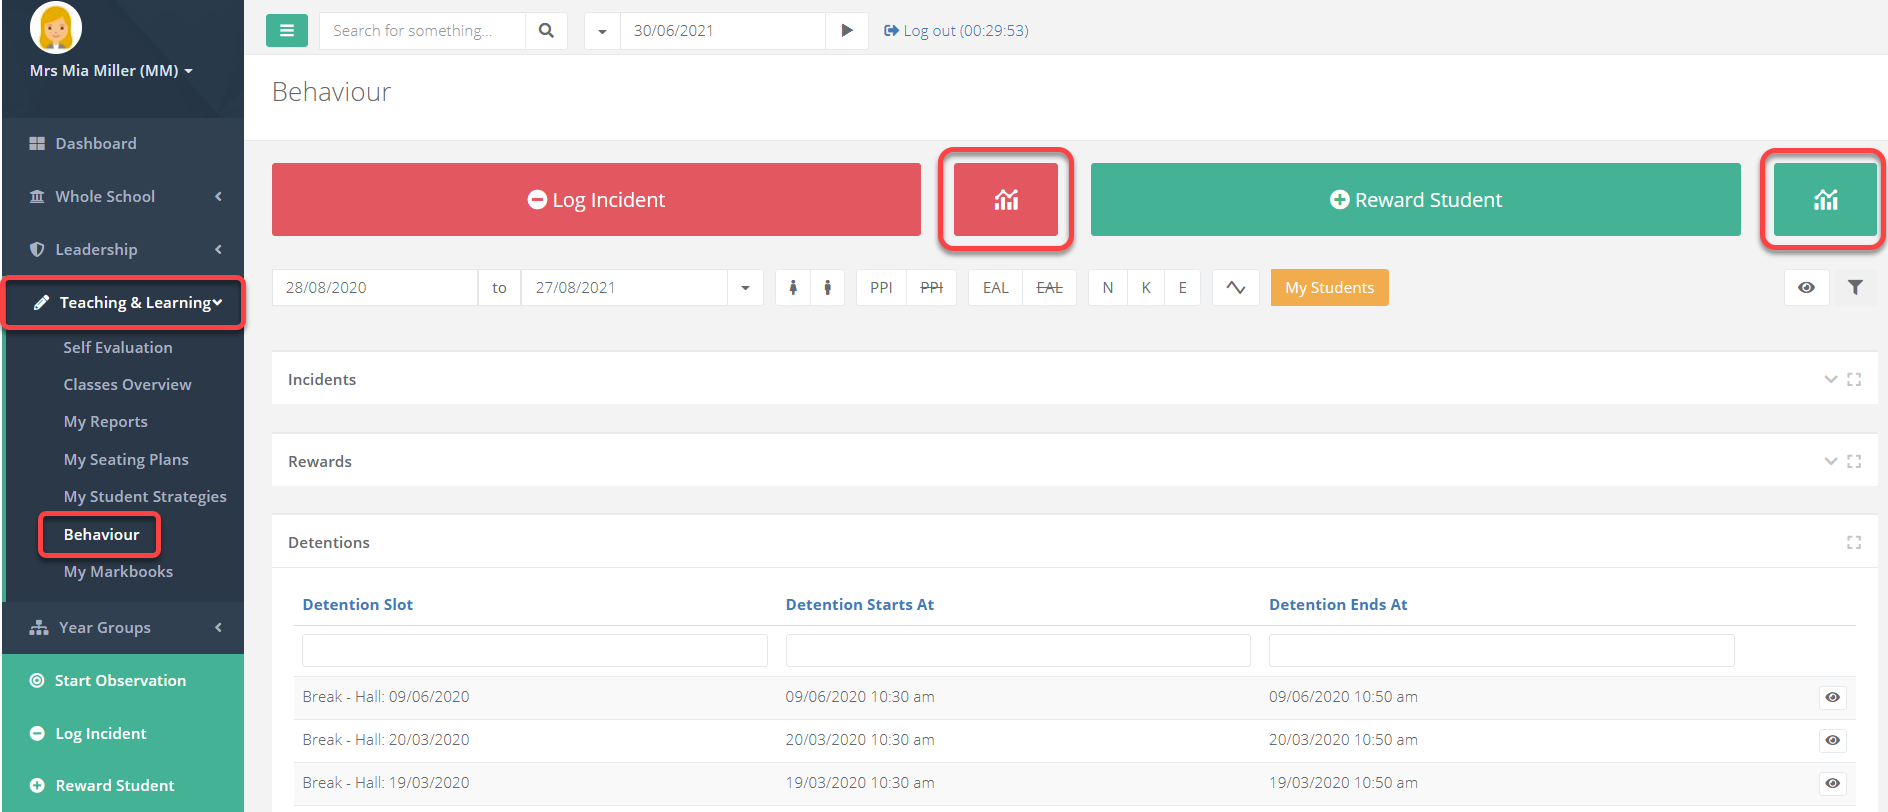
Select Teaching & Learning > Behaviour from the menu to access the behaviour dashboard. The reporting feature is separate for incidents and rewards. Select the appropriate graph icon depending on what data you are after.
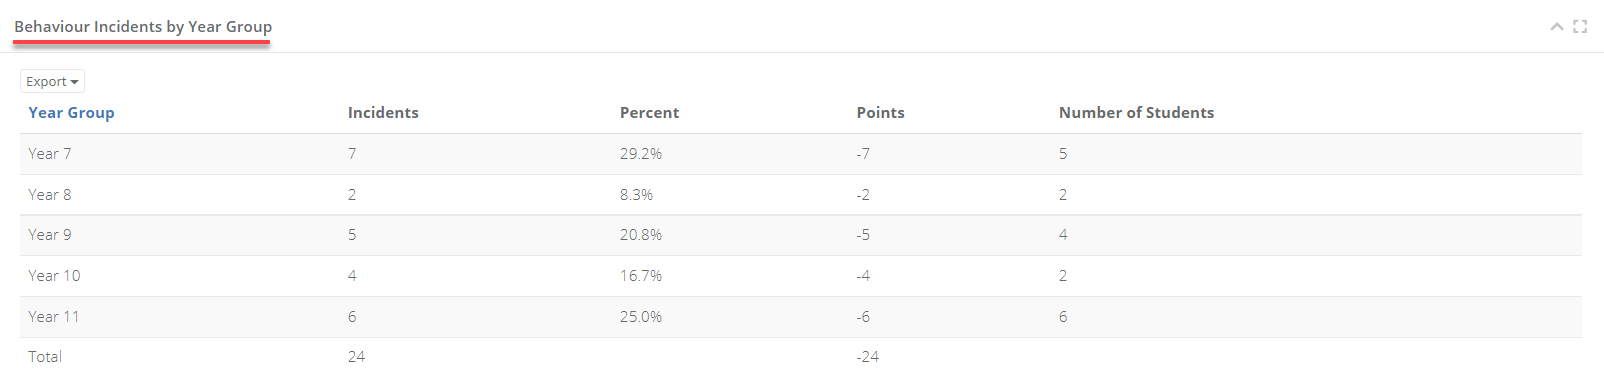
The report page consists of different report headings. You can click on a heading to expand the data. There is also an export option at the bottom of the page.
Filtering the data
behaviour data loads the current term by default within the date range. You can enter a different range, or select one from a pre-defined list by using the arrow next to the date field.
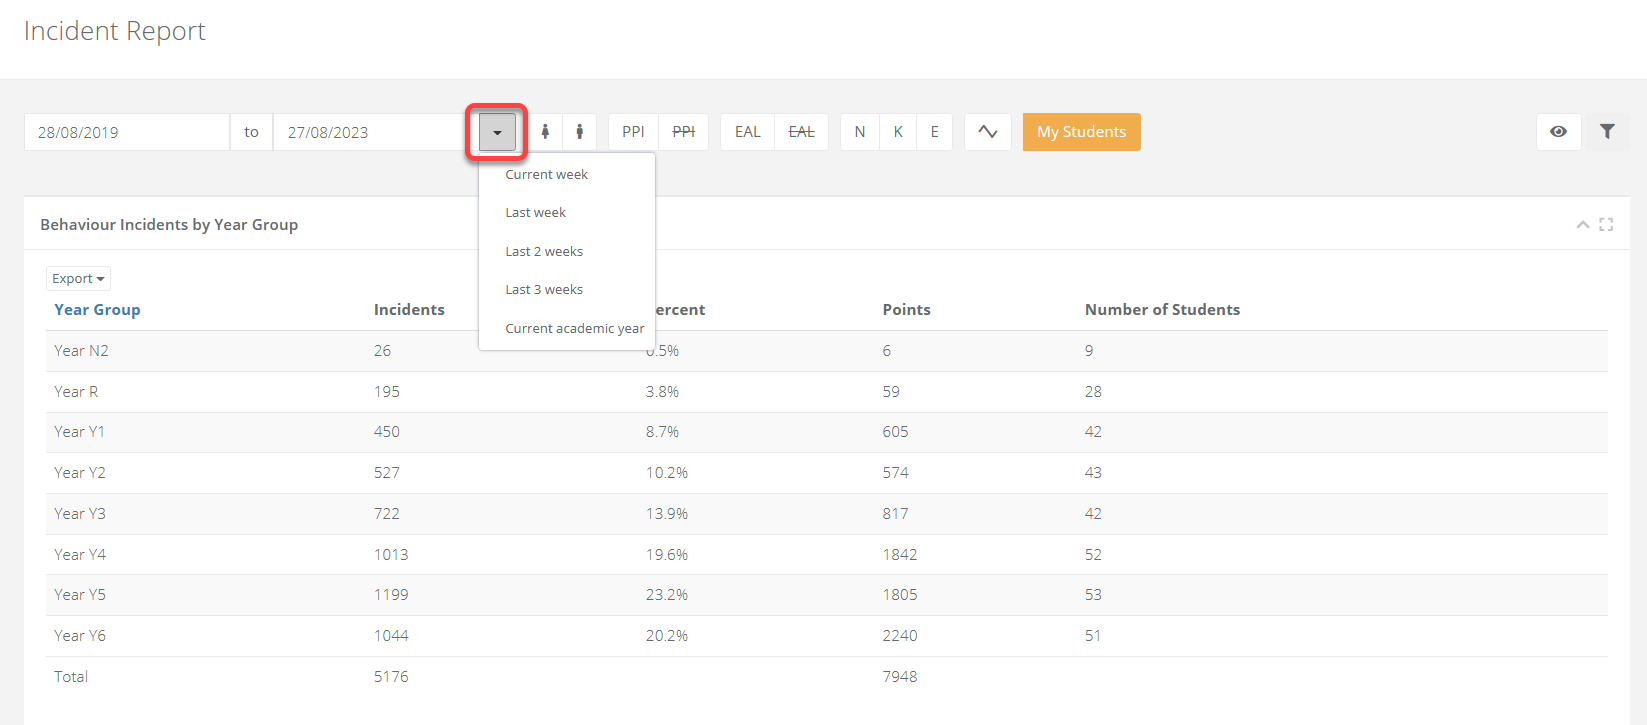
The eye icon allows you to see and select additional filters.
Once you chosen your filters, select the blue filter icon to refresh the data.
Was this article helpful?