- 1 Minute to read
- Print
- DarkLight
- PDF
KS1 KS2 RWM Venn Diagrams
- 1 Minute to read
- Print
- DarkLight
- PDF
KS1 and KS2: RWM Venn Diagrams
Accessing the report
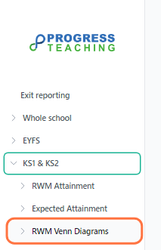
Click ‘KS1 & KS2’, then ‘RWM Venn Diagrams’, in the left sidebar.
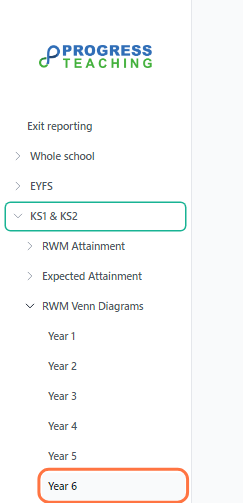
Select a year from the list.
Filtering the report
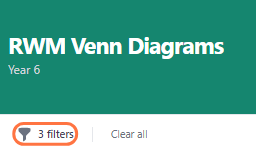
Click the filter icon to expand the filters.
You can select a year group, term, and/or academic year.
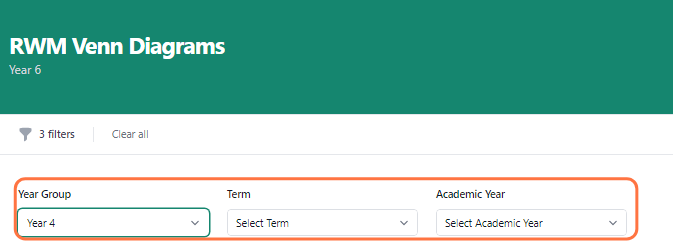
Click ‘Apply filters’ to update the report.

Press ‘Clear all’ to remove the filters and to the default view, which shows the latest available data.
Report sections
Note that this report shows data only for pupils who have grades for each of Reading, Writing, and Mathematics.
At Expected
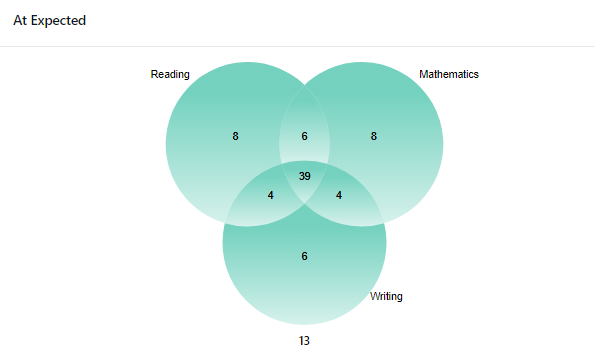
This shows the overlap of subject grades at Expected or higher. For example, here four pupils are at Expected or higher in Reading and Writing, but not in Mathematics.
At Greater Depth
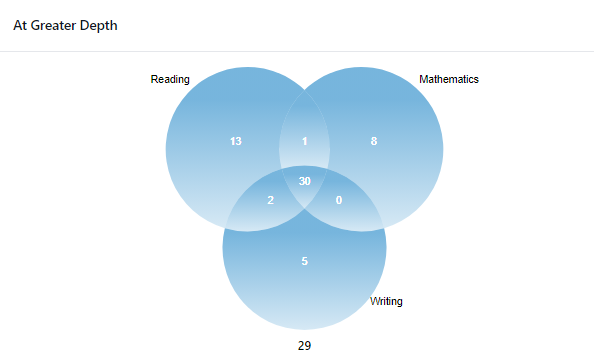
This shows the overlap of subject grades at Greater Depth. For example, here two pupils are at Greater Depth in Reading and Writing, but not in Mathematics.
Student Breakdown
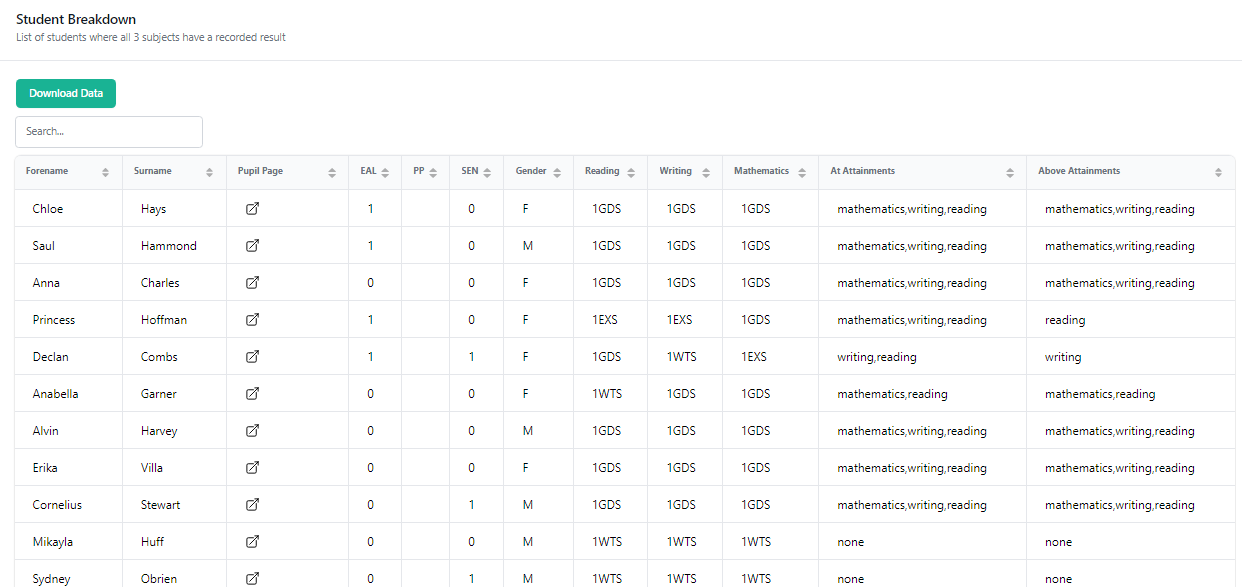
This table shows the individual grades for each student, as well as key contextual information such as their EAL status.
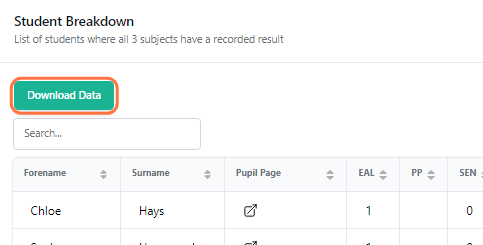
Press ‘Download Data’ to receive an xslx file containing this information.
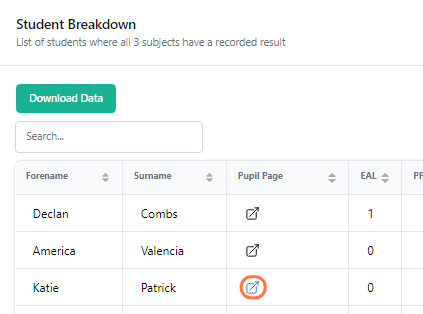
Press the link icon beside a pupil’s name to visit their pupil overview page.

