Leadership overview
- 1 Minute to read
- Print
- DarkLight
- PDF
Leadership overview
- 1 Minute to read
- Print
- DarkLight
- PDF
Article summary
Did you find this summary helpful?
Thank you for your feedback!
This page allows you to quickly identify:
- How many observations have taken place for each member of staff.
- When a member of staff was last observed.
- The number of observations recorded by each observer
How to access the leadership overview
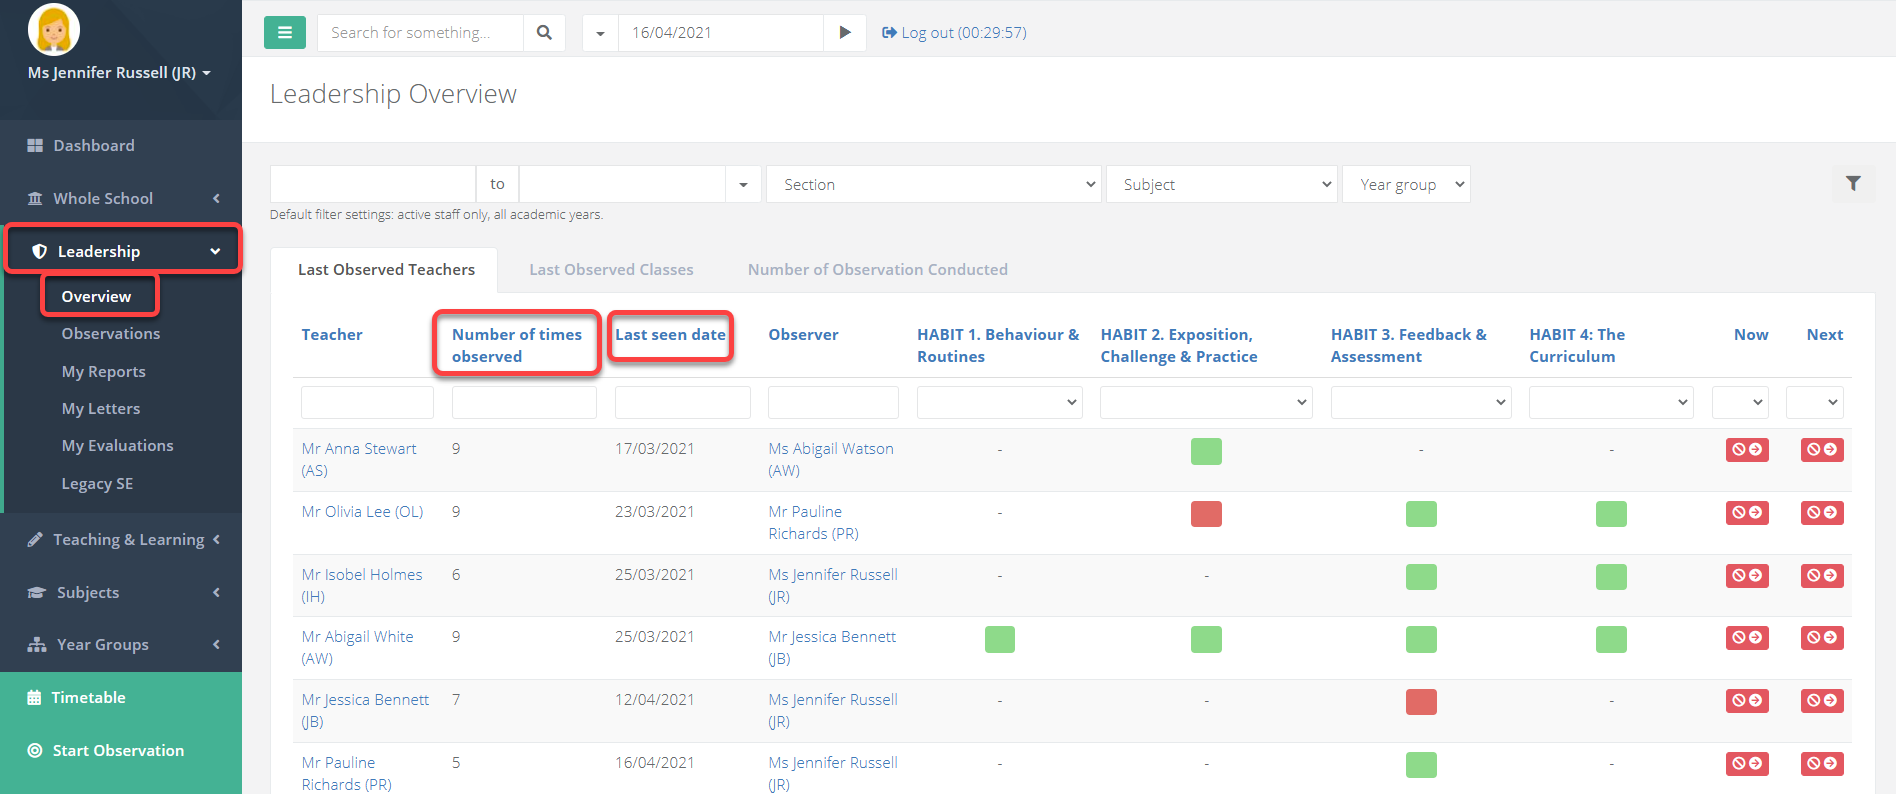
- Select Leadership > Overview from the menu. The page will display a list of your observable staff. You will see the number of times the teacher has been observed, as well as the date of the most recent observation.
Staff are ordered by the recency of their last observation. A teacher that has not been observed for some time will appear near the top of the list, whereas a teacher who was recently observed will appear near the bottom of the list.
You can reverse this order by selecting the column Last seen date.
How to start an observation from the leadership overview
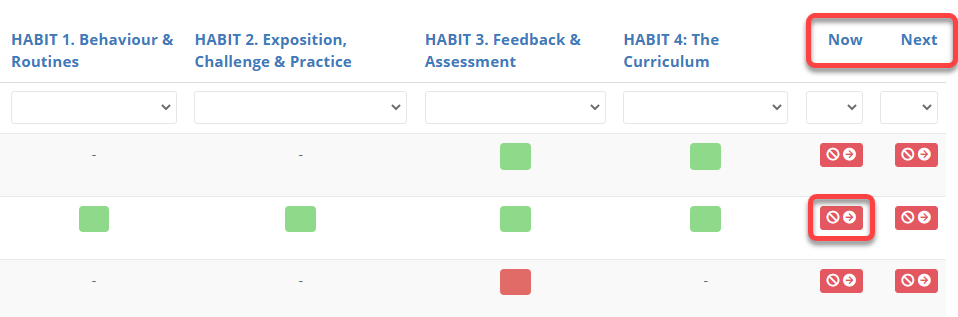
- The options to the right will be green if the teacher is teaching now, or in the next period. Selecting each of the icons will allow you to start an observation for the class.
Filtering the leadership overview for a date range
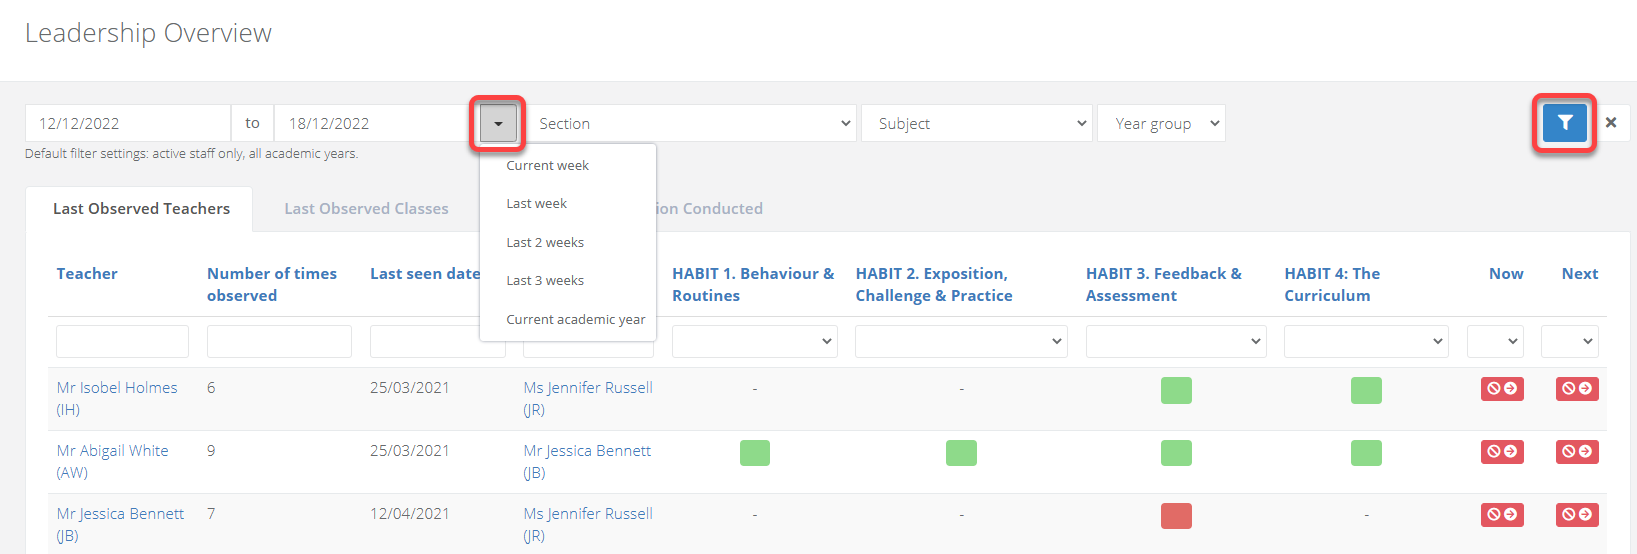
- The list can be filtered for specific date ranges using the arrow icon. Once you have selected a date range, click the blue filter to refresh the page.
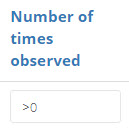
The column Number of times observed can be filtered to help you answer specific questions.
To see which teachers have not had an observation conducted of them, filter the column for 0.
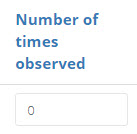
To see which teachers have had at least one observation conducted of them, filter the column for >0.
Viewing data on observers
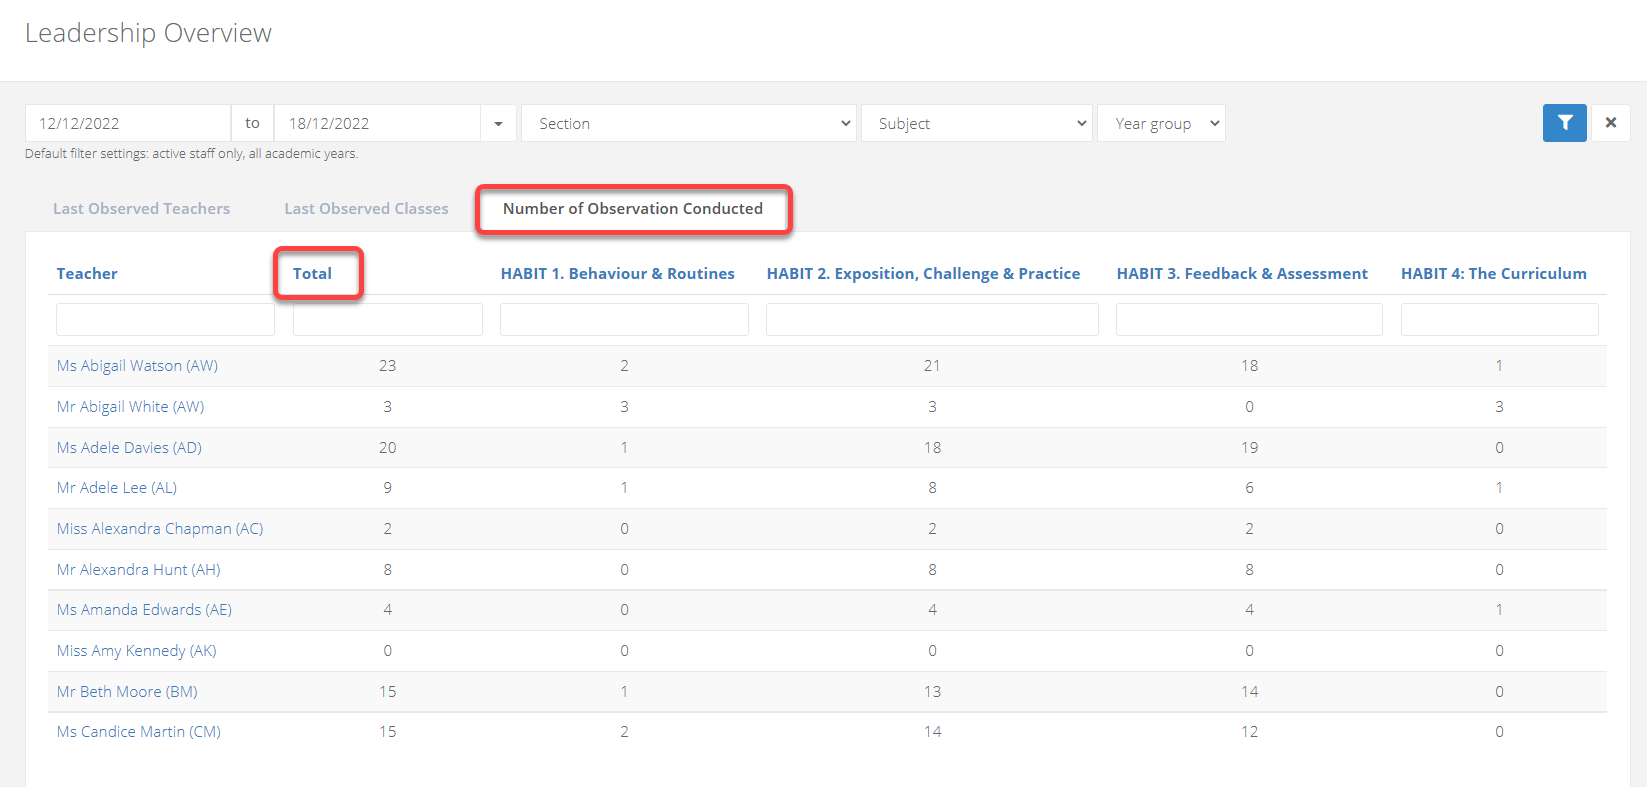
- Selecting the tab Number of observations conducted will show you data on your observers. You will see the number of observations each manager has conducted, as well as the number of times they have evaluated each strand.
Once again you can select the columns to order the lists on the page.
Each column can also be filtered with mathematical arguments like <2 and so on.
Was this article helpful?