- 1 Minute to read
- Print
- DarkLight
- PDF
Whole School Attendance
- 1 Minute to read
- Print
- DarkLight
- PDF
Whole School: Attendance
Accessing the report
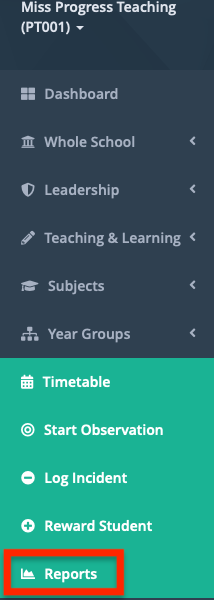
In your platform, select 'Reports' in the left sidebar.
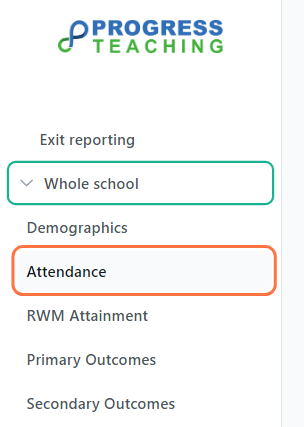
Click ‘Whole School', then ‘Attendance’, in the left sidebar.
Filtering the report
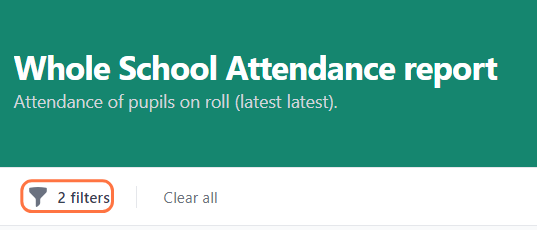
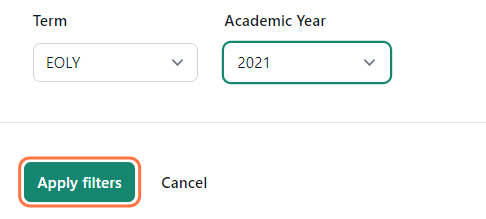
Click the filter icon to expand the filters.
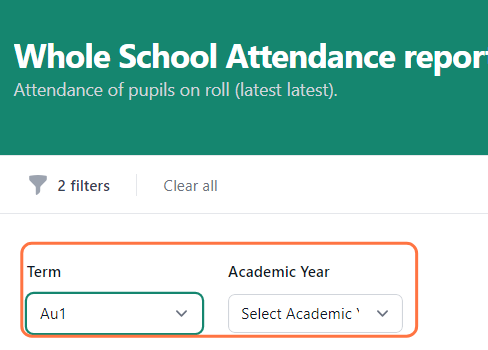
You can select a term and/or academic year.
Click ‘Apply filters’ to update the report.
Press ‘Clear all’ to remove the filters and to the default view, which shows the latest available data.
Report sections
This report shows attendance data from your MIS, imported via Groupcall.
Headline Figures

The headline figures show:
- The total number of students on roll;
- The average attendance ;
- The average lateness;
- Persistent absence.
- Persistent absence is defined as the % of pupils with individual attendance rates below 90%.
Attendance & Lateness
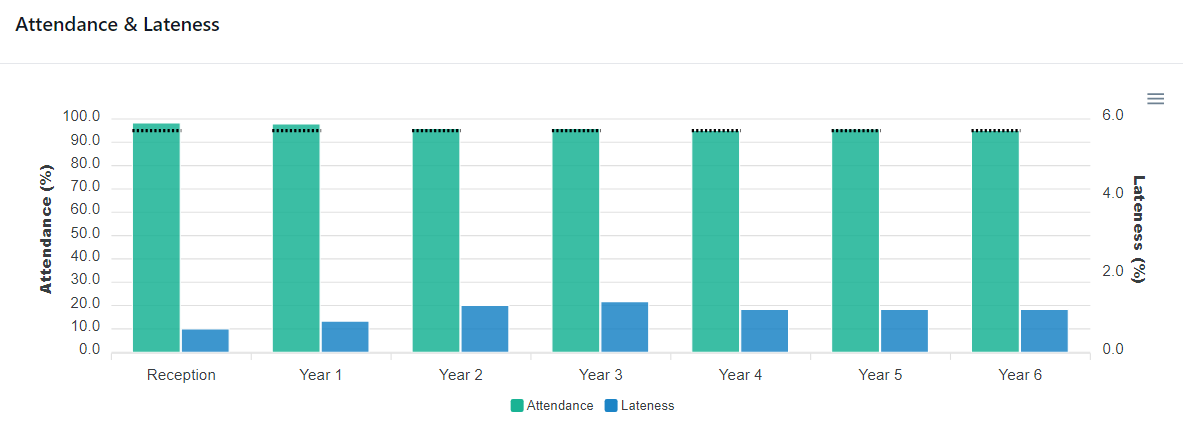
This chart shows attendance and lateness by year group. Note that each metric has its own scale to preserve detail: attendance is on the left, and lateness is on the right. The National Expectation of 95% is shown as a dotted line.
Hovering over a year group shows the exact attendance and lateness figures for the group.
Persistent Absence (<90%)
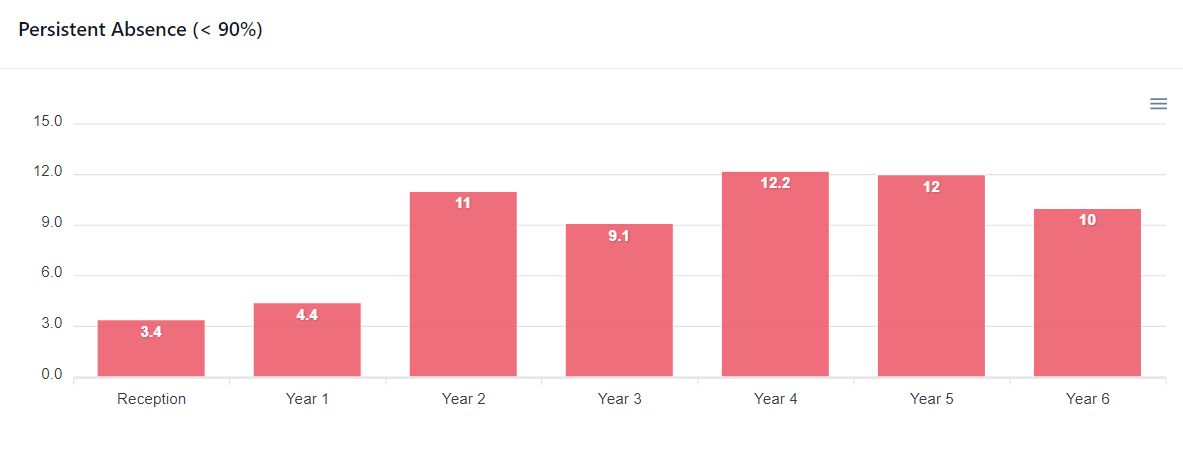
This chart shows the percentage of a year group that is persistently absent.
Weekly Attendance
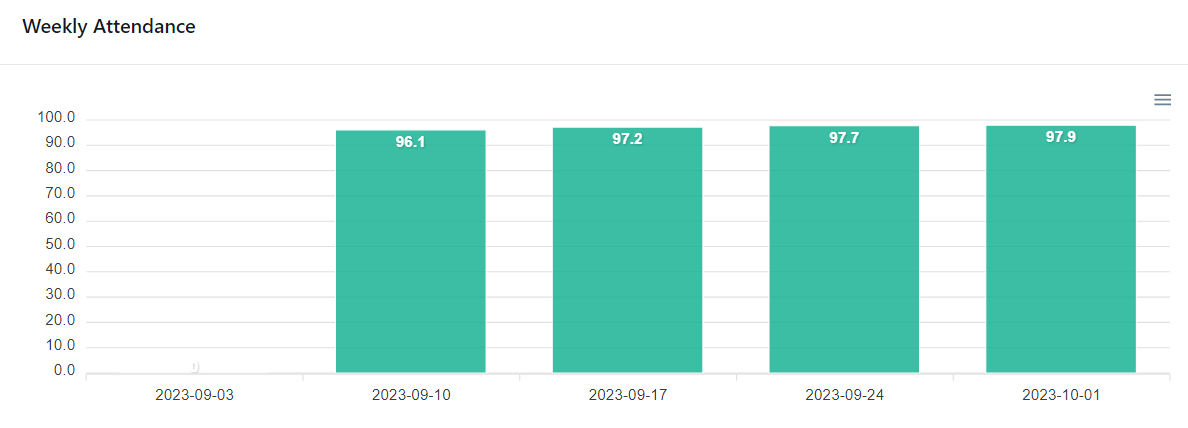
This displays average weekly attendance. Holiday week columns are shown so that users can quickly identify half-termly blocks and note patterns, if any, at either side of the holidays.
Persistent Absentee Student List
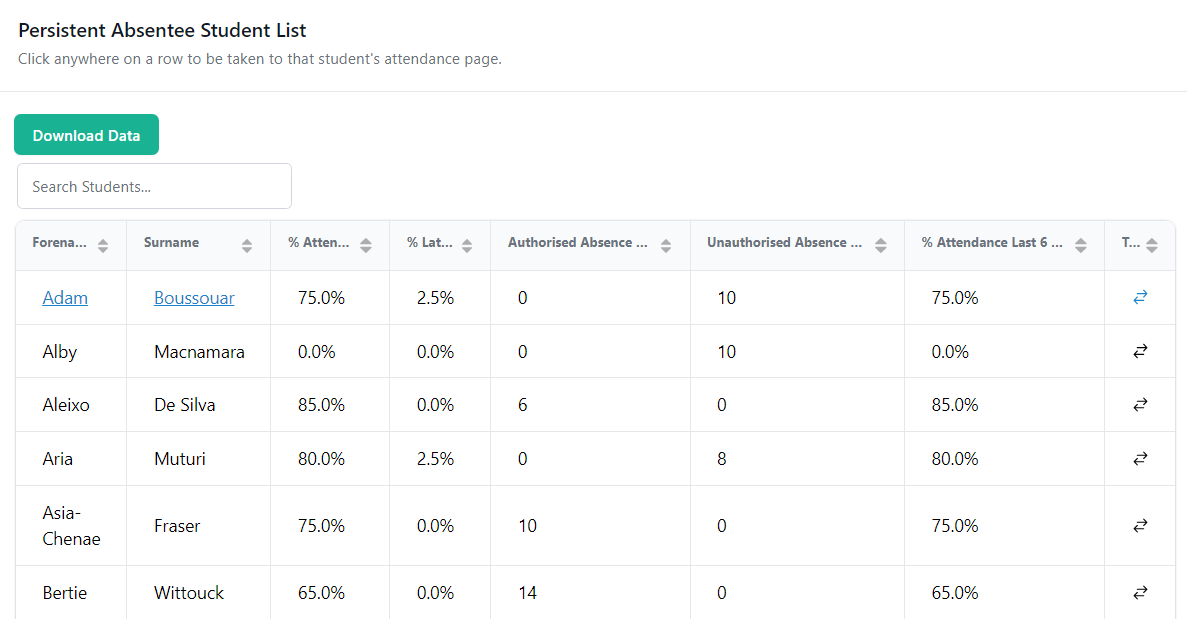
This table is a list of all persistently absent pupils across the school.
Users can search for particular pupils, sort the data, and download it for further use.
Click a pupil’s row to reach their attendance page, which is described in more detail here.

