- 1 Minute to read
- Print
- DarkLight
- PDF
Whole School Demographics
- 1 Minute to read
- Print
- DarkLight
- PDF
Whole School: Demographics
Accessing the report
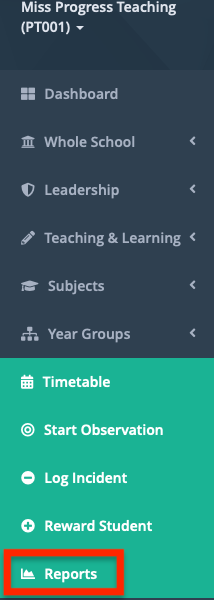
In your platform, select 'Reports' in the left sidebar.
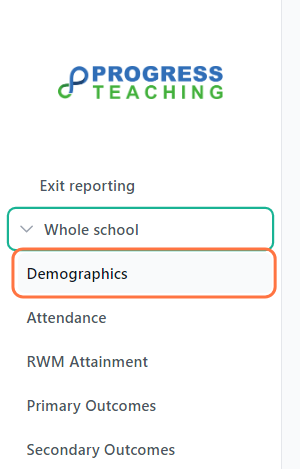
Click ‘Whole School', then ‘Demographics’, in the left sidebar.
Filtering the report
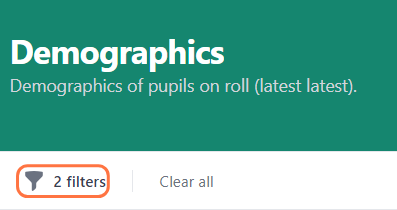
Click the filter icon to expand the filters.
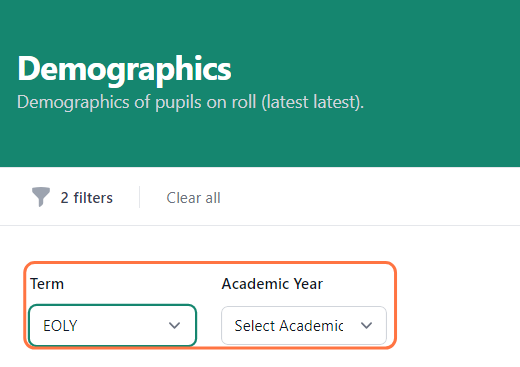
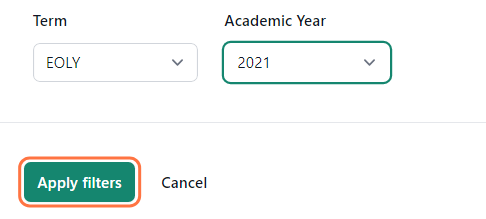
You can select a year group, term, and/or academic year.
Click ‘Apply filters’ to update the report.
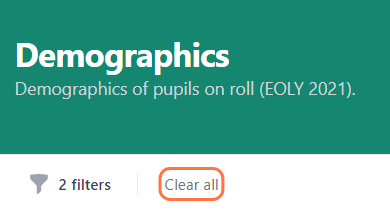
Press ‘Clear all’ to remove the filters and to the default view, which shows the latest available data.
Report sections
Headline Figures

The headline figures show, as at the selected date and year, the number of pupils:
- On roll, and the gender breakdown for this figure.
- Who joined in Reception, and this figure as a fraction and percentage of the total roll.
- Who were summer born, and this figure as a fraction and percentage of the total roll.
- Who receive Pupil Premium, and this figure as a fraction and percentage of the total roll.
Whole School Overview
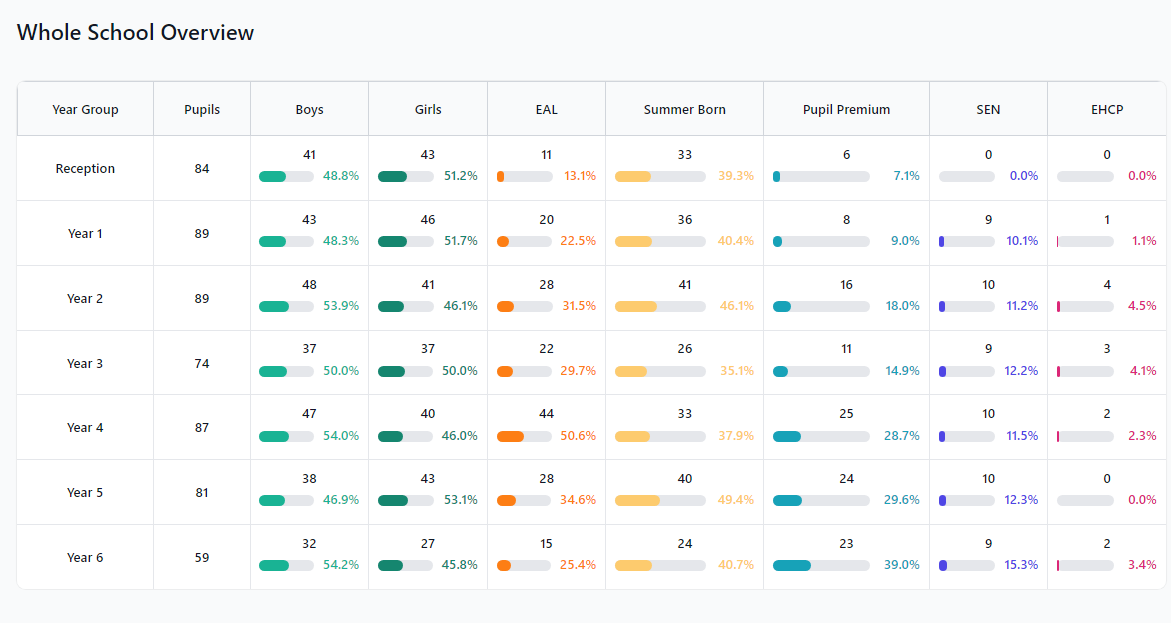
This table shows all the demographic information for the school in one place. It outlines the membership of key demographics groups by year across the school.
Pupils on roll
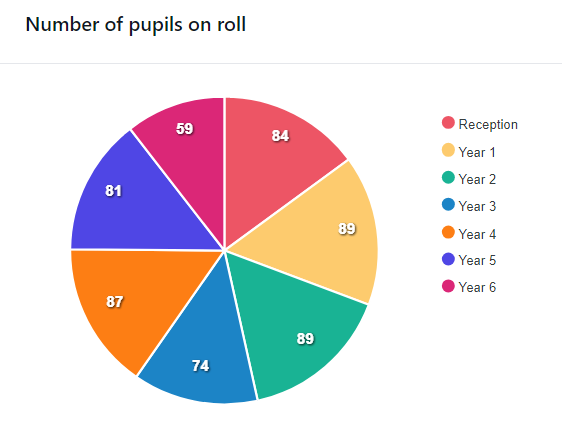
This chart shows the number of pupils on roll, by year group. Hover over sections to see which year they represent.
Gender Distribution
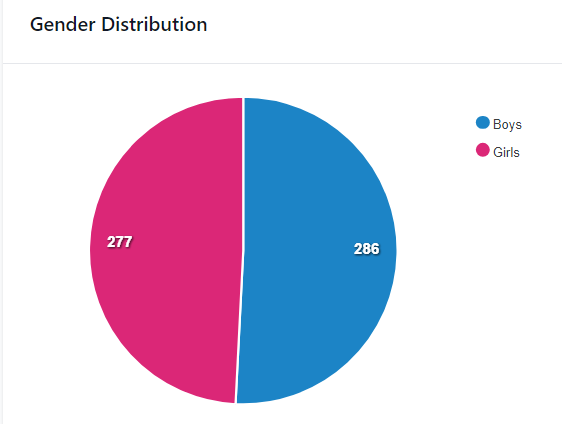
This chart shows the gender breakdown of the pupils on roll. Hover over sections to see which gender they represent.
Joined in Reception
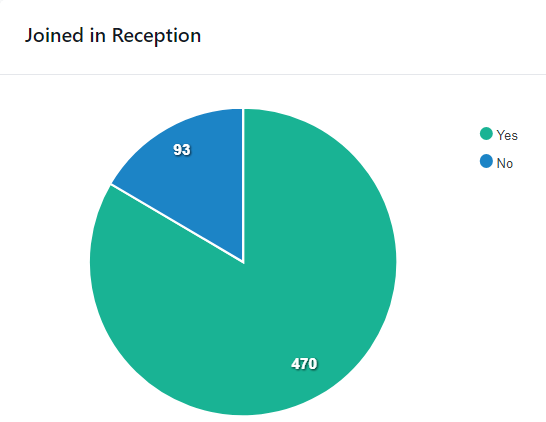
This chart shows the proportion of pupils on roll who joined in Reception. Hover over sections to see which group they represent.
Term of birth
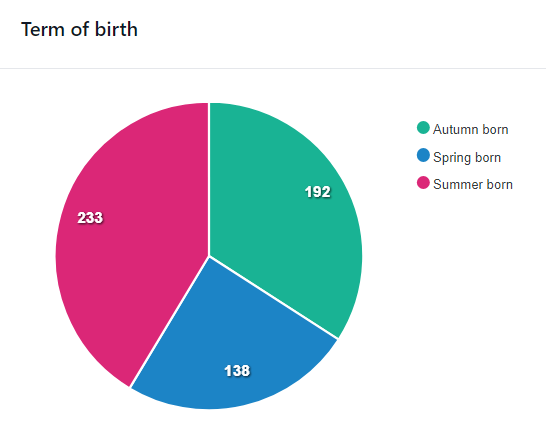
This chart shows birth term distribution across the school. Hover over sections to see which term they represent.
Percentage of EAL pupils
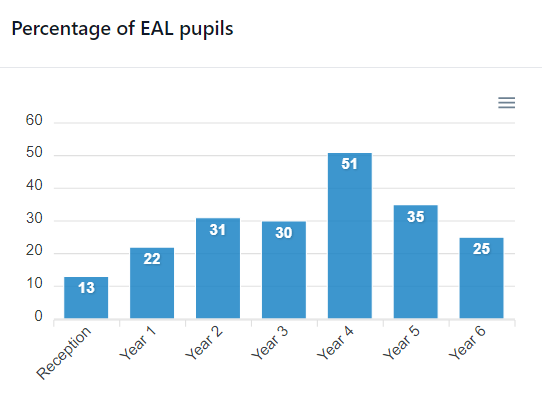
This chart shows the percentage of EAL pupils by year group.
The percentage is relative to the rest of the year rather than the rest of the demographic group. For example, '13' for Reception indicates that 13% of the Reception roll are EAL, not that 13% of EAL students in the school are in Reception. This is also why the total percentage does not sum to 100%.
Percentage of Pupil Premium pupils
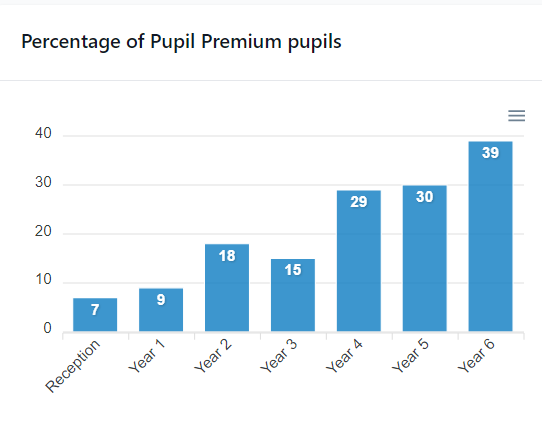
This chart shows the percentage of Pupil Premium pupils by year group.
As above, this percentage is relative to the rest of the year group rather than the rest of the demographic group.
Number of SEN / SEND pupils
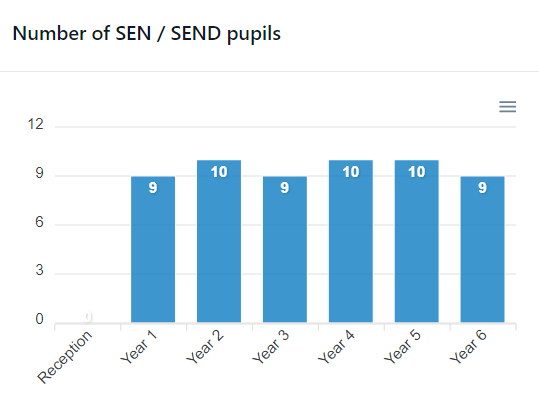
This chart shows the number of SEN / SEND pupils by year group.
Number of EHCP pupils
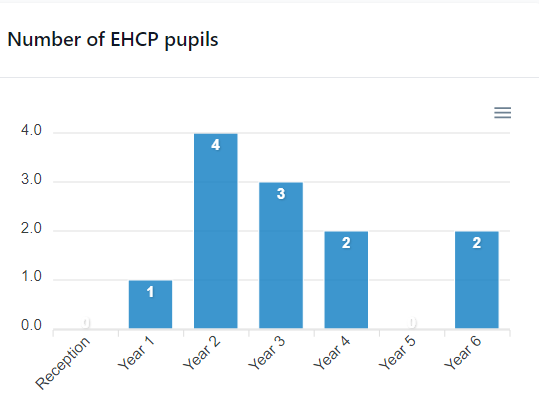
This chart shows the number of pupils with an EHCP by year group.

