Whole School Primary Outcomes
- 1 Minute to read
- Print
- DarkLight
- PDF
Whole School Primary Outcomes
- 1 Minute to read
- Print
- DarkLight
- PDF
Article summary
Did you find this summary helpful?
Thank you for your feedback!
Whole School: Primary Outcomes
Accessing the report
Click ‘Whole School', then ‘Primary Outcomes’, in the left sidebar.
Report Sections
Every table in this report can be downloaded as an .xlsx file for further use.
EYFS
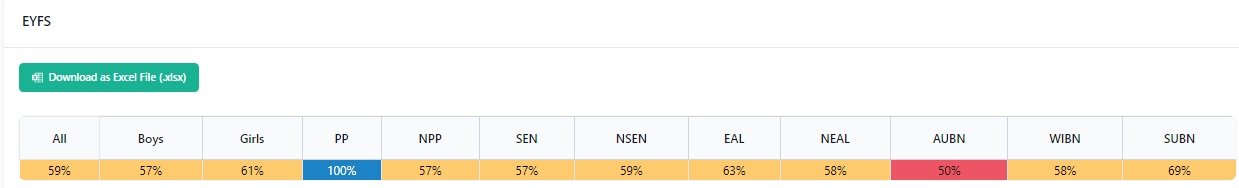
This shows the latest EYFS data regarding achievement of GLD, with the highest and lowest-performing demographics marked in blue and red respectively.
Phonics
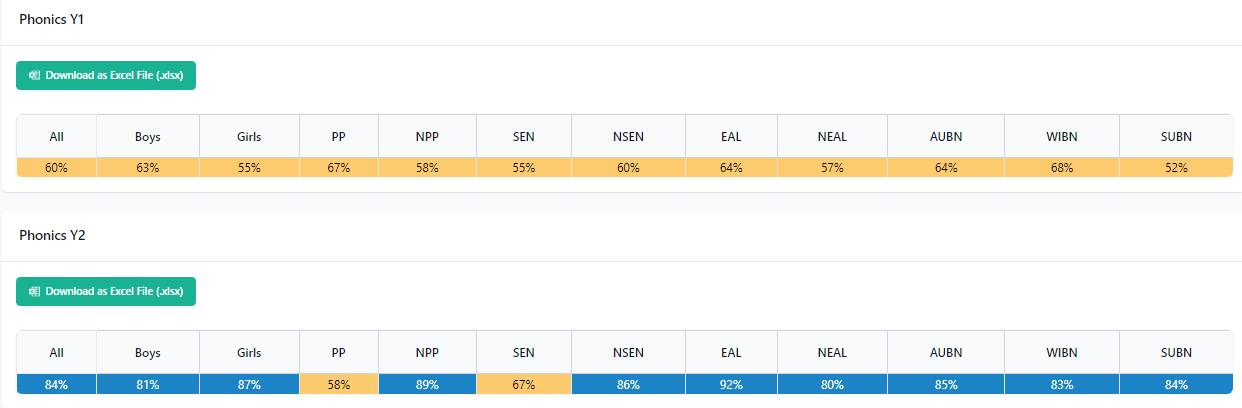
These tables show the outcomes of the Phonics Screening Check for Years 1 and 2. The colouring for this and subsequent tables is as follows:
- <= 50% → red
- > 50% → yellow
- >= 70% → green
- >= 80% → blue
End of Key Stage 1
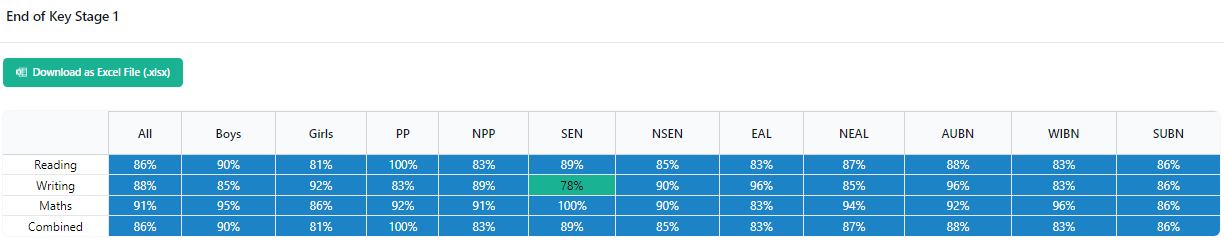
The next table displays RWM and Combined attainment data at the end of KS1, by demographic.
MTC
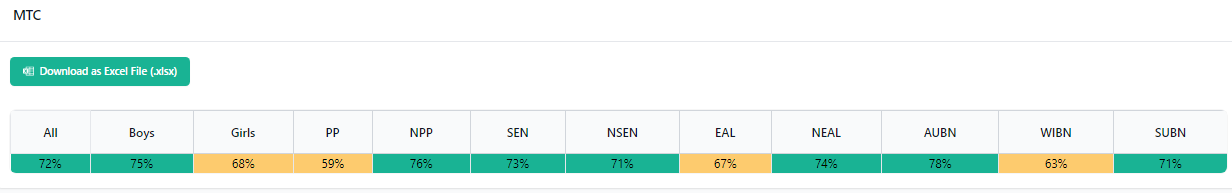
The MTC data displays attainment on the Multiplication Tables Check, by demographic.
End of Key Stage 2
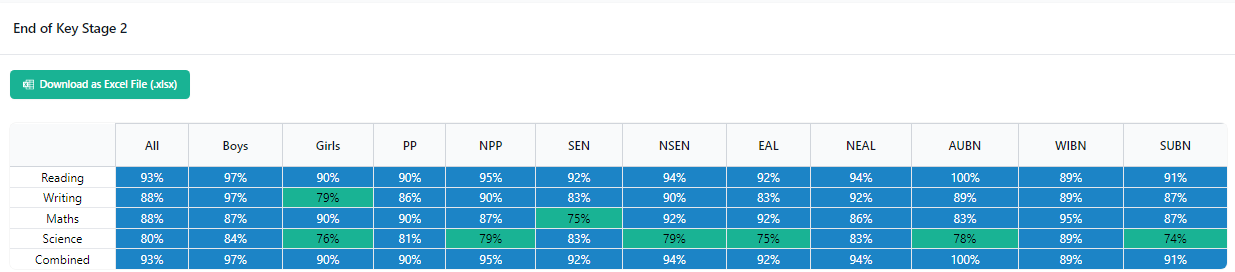
The next table displays RWM and Combined attainment data at the end of KS2, by demographic.
Was this article helpful?