Trust Feedback Strengths
- 5 Minutes to read
- Print
- DarkLight
- PDF
Trust Feedback Strengths
- 5 Minutes to read
- Print
- DarkLight
- PDF
Article summary
Did you find this summary helpful?
Thank you for your feedback!
Celebrate practice and identify lead practitioners across your trust
The Trust Feedback Strengths dashboard allows you to track the extent to which practice is being celebrated in schools across your trust so that leaders can immediately answer questions like:
- How do I know if my schools are frequently celebrating their teachers' strengths?
- How can I see what the content of teachers' strengths is?
To access this dashboard, navigate to Dashboards > Trust Feedback Strengths
Applying filters to the Trust Feedback Strengths dashboard
Below is a key with descriptions of all the filtering features available on your Trust Feedback Strengths dashboard.
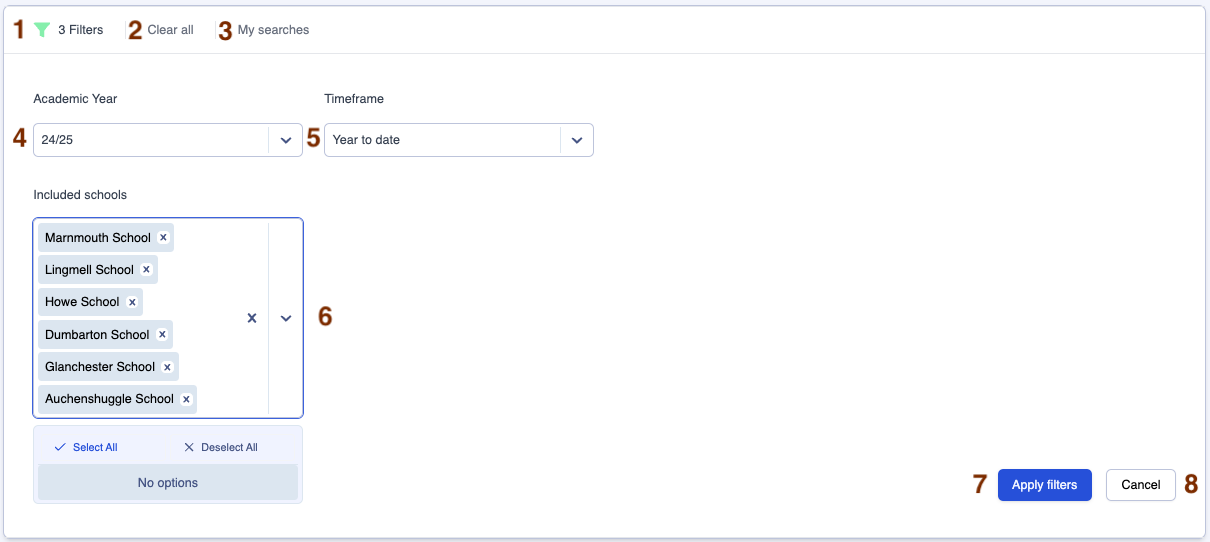
| Area | Feature description |
|---|---|
| 1 | Click on the filter icon to hide or reveal the filters box |
| 2 | Click on 'Clear all' to clear all filters |
| 3 | Click on 'My Searches' to access past searches you have saved (See the 'Using My Searches' section below) |
| 4 | Use the 'Academic Year' filter to switch between academic years (The current academic year is the default year when you navigate to the page) |
| 5 | Use the 'Timeframe' filter to determine the time period for which you wish to view your data (See the 'Selecting different timeframes' section below for a full explanation) |
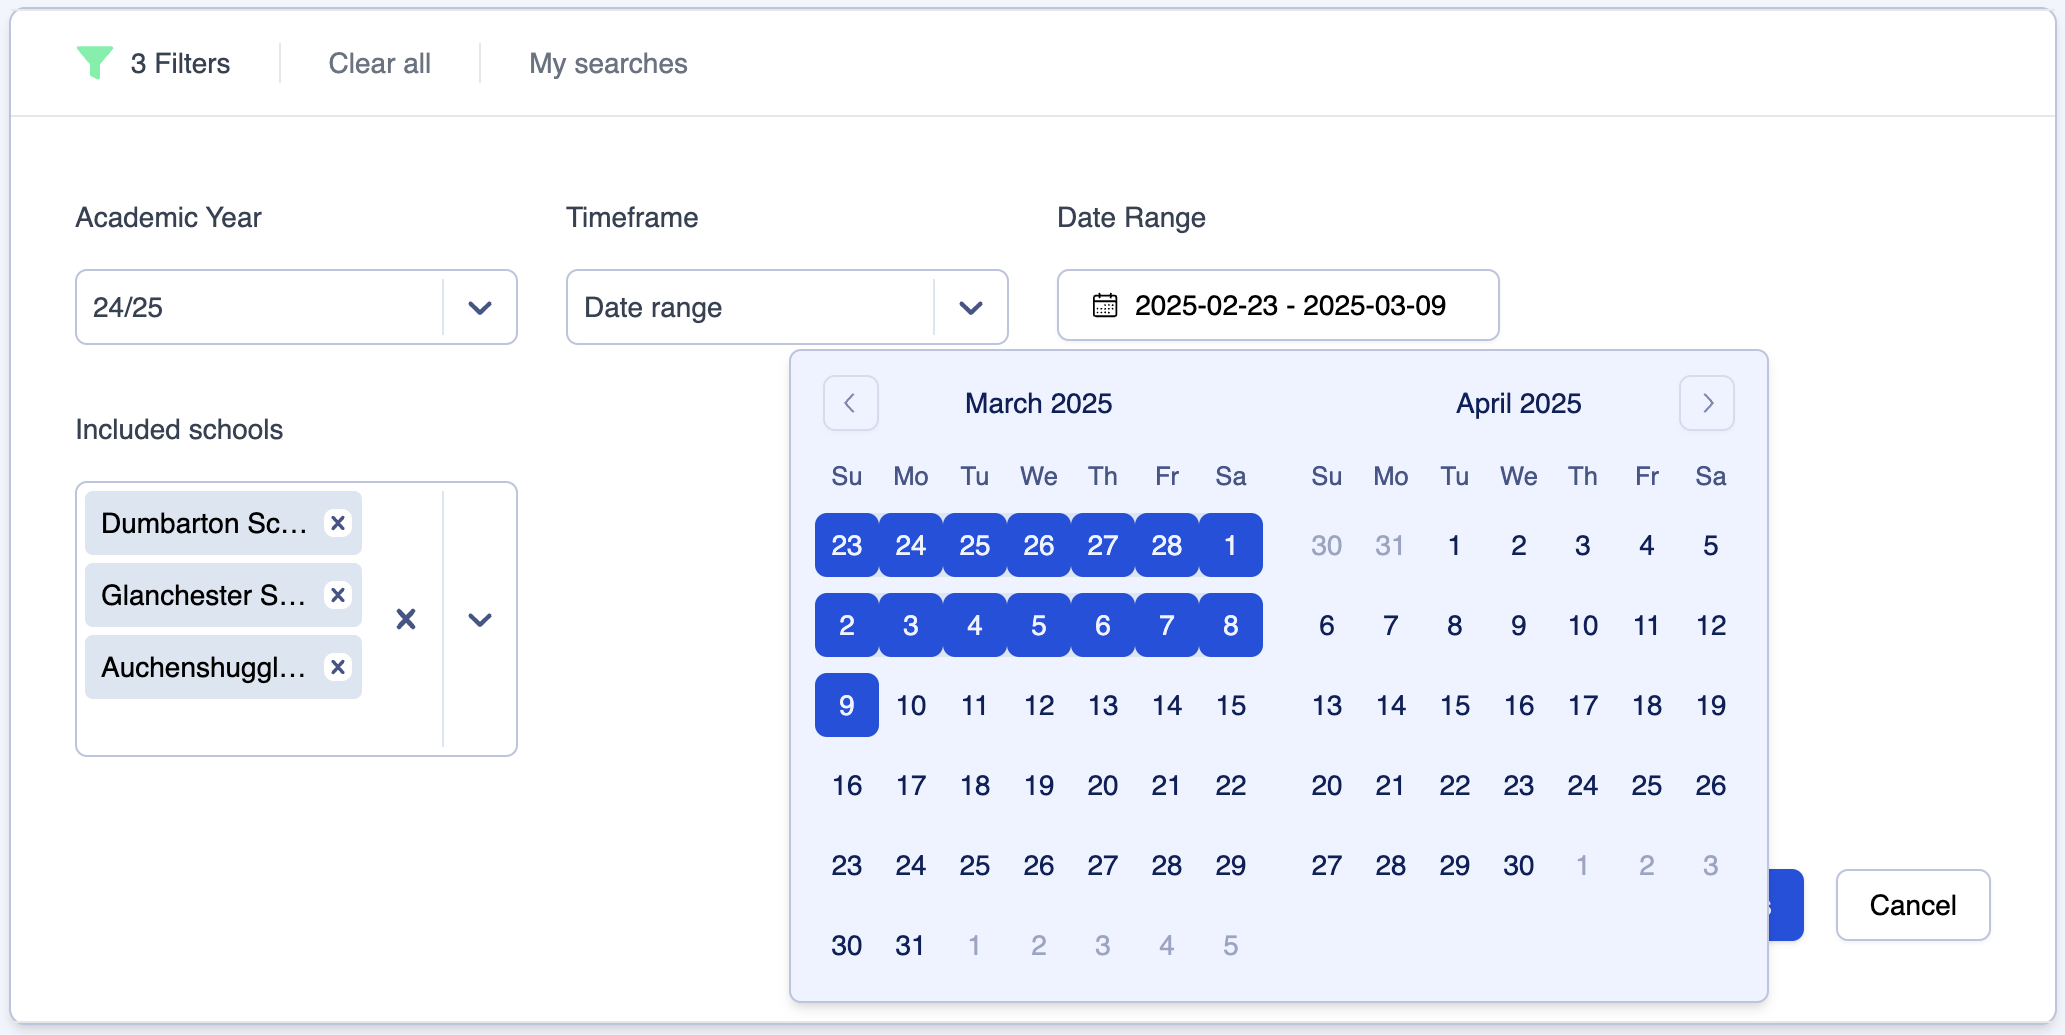
| 6 | Use the 'Included schools' filter to view data for all schools or selected schools only |
| 7 | Click on 'Apply filters' to apply the filters you have selected |
| 8 | Click on 'Cancel' to hide the filters box |
Using 'My Searches'
The 'My Searches' button allows you to save your favourite filter settings in all dashboards.
Below is a key with descriptions of all the 'My Searches' features.
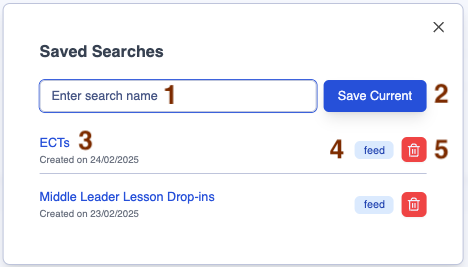
| Area | Feature description |
|---|---|
| 1 | Field to enter your preferred search name |
| 2 | Click on 'Save Current' to save the current set of filters you have applied to the dashboard |
| 3 | Click on the hyperlink to open the dashboard with your preferred filters |
| 4 | This box indicates the dashboard to which this saved search applies |
| 5 | Click on the rubbish bin icon to delete the saved search |
Saving a new search
Step 1
Select the filters you want to apply in the dashboard, for example:
Step 2
Click on the 'My searches' button then enter your preferred search name, for example, 'Southern Schools':
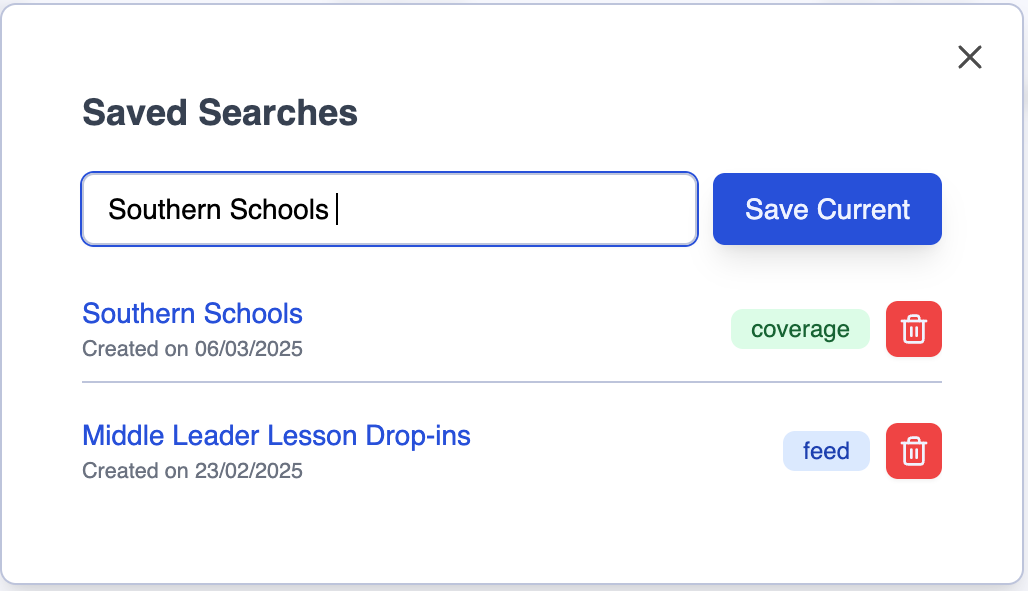
Step 3
Click on 'Save Current' to save your search name along with the selected dashboard filters.
Selecting different timeframes
1. Year to date
The default setting is 'Year to date', so the data you are viewing when you first land on the page is from the first day of this academic year up to today.
2. Half term range
In the 'Timeframe' filter, select 'Half term range', then specify the 'Start Term' and 'End Term' to compare the data between two half terms.
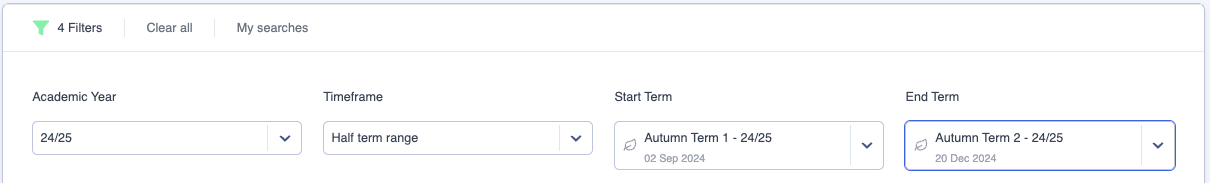
Click on 'Apply filters' (Area 7 in the key above) to apply the filters you have selected.
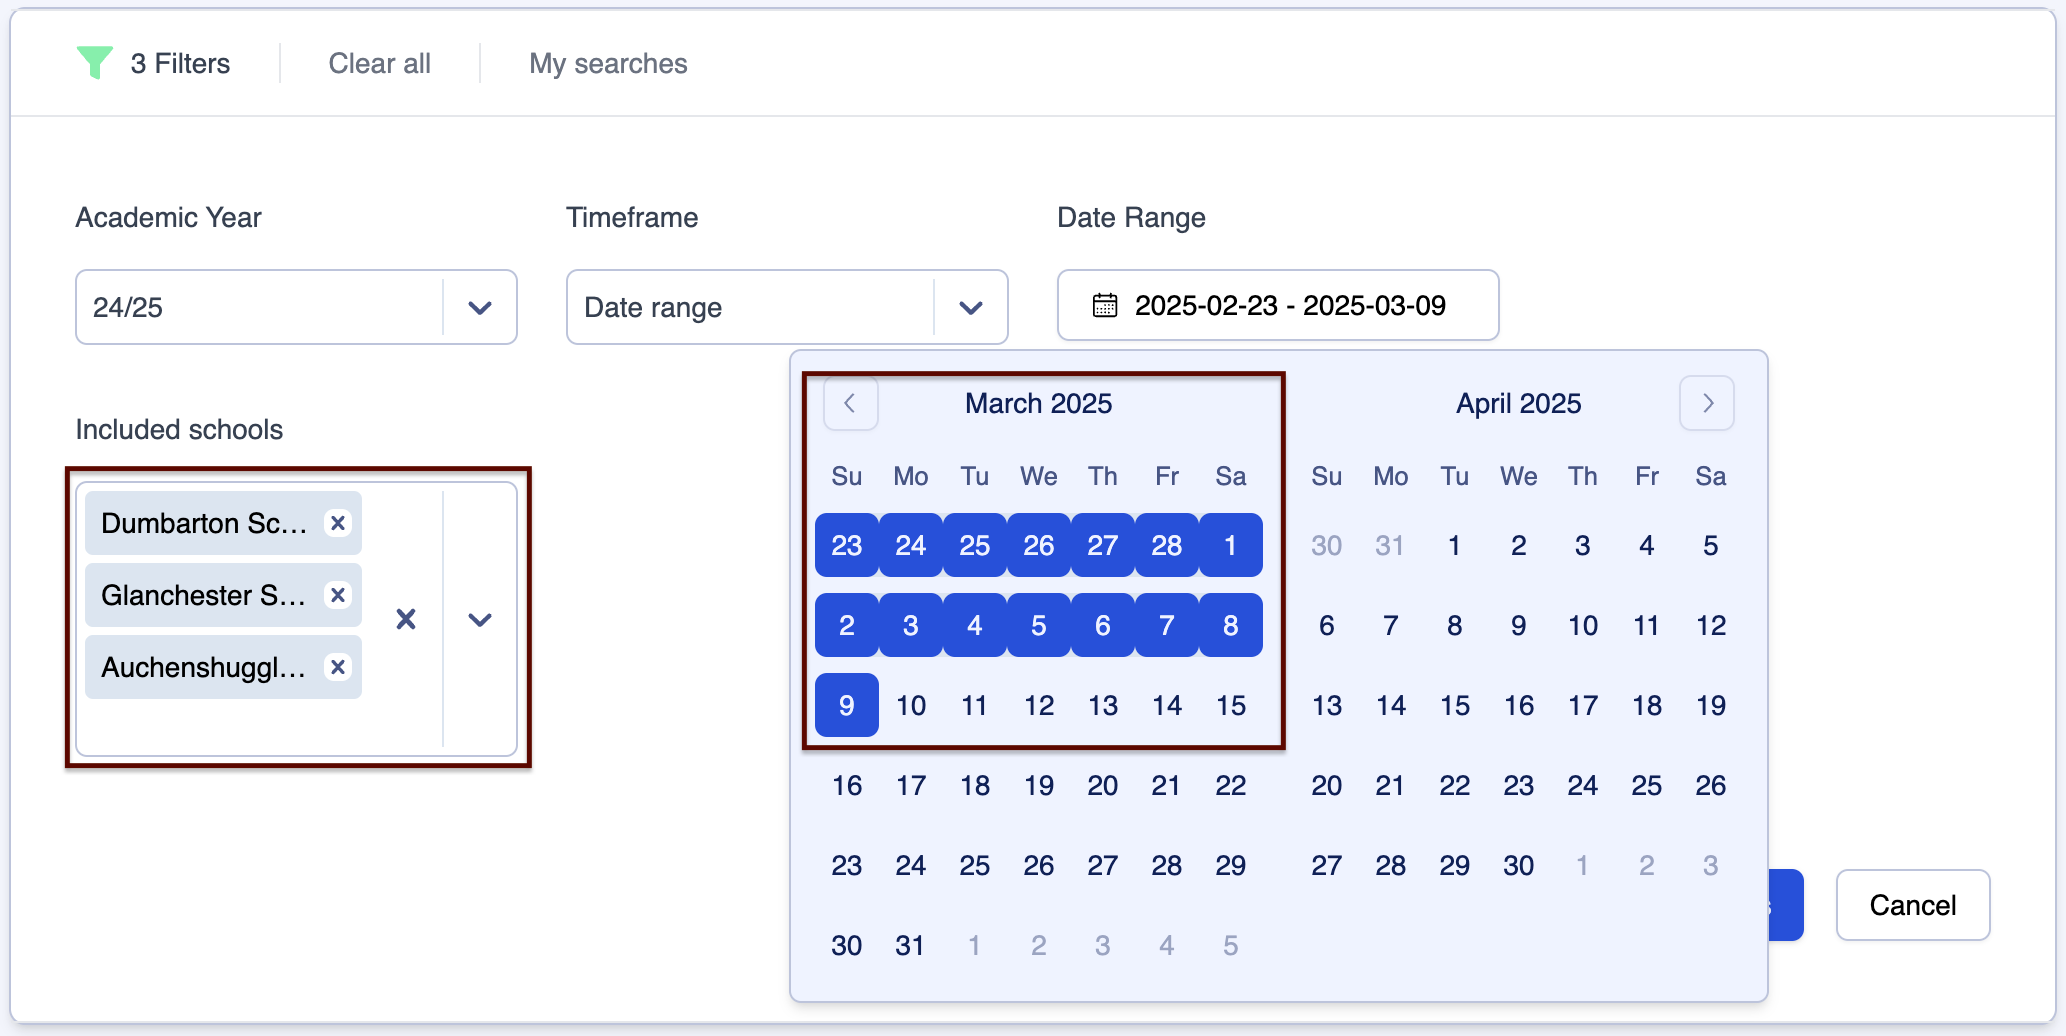
3. Specific date range
In the 'Timeframe' filter, select 'Date range' then click in the 'Date Range' filter to reveal a calendar. Select a start date and an end date in the calendar. Your selected date range will then be highlighted in navy blue.
Click on 'Apply filters' to apply the filters you have selected.
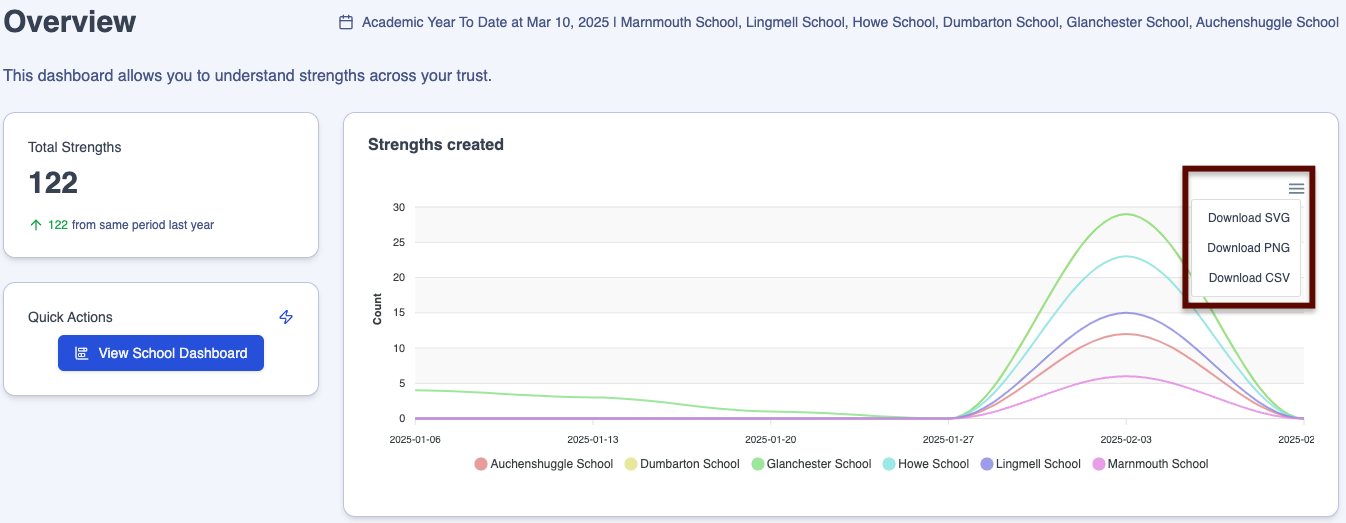
Trust Feedback Strengths dashboard 'Overview'
Below is a key with descriptions of all the features available in the 'Overview' section of your Trust Feedback Strengths dashboard.
| Area | Feature description |
|---|---|
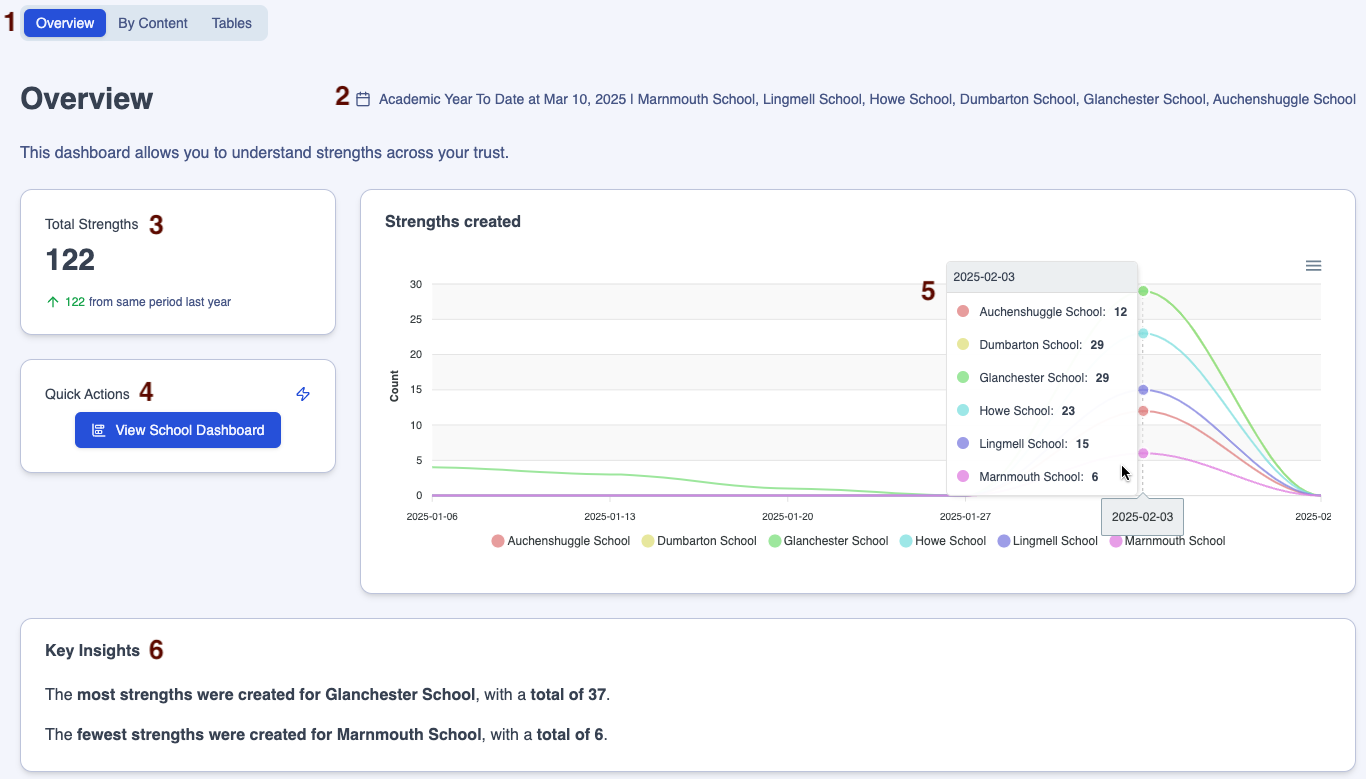
| 1 | 'Overview' is highlighted, indicating that data from all strengths is represented in this section |
| 2 | This header displays the filters selected |
| 3 | The 'Total Strengths' tile displays the total number of strengths created for the selected timeframe as well as a comparison with the same period from last year, where available |
| 4 | The 'Quick Actions' tile gives you the option to click on the 'View School Dashboard' button to view the equivalent school-level data at the school whose platform you are logged into |
| 5 | Hover over the line graph to show the number of strengths created week on week |
| 6 | The 'Key Insights' tile provides summary sentences about the data |
Feedback Strengths dashboard 'By Content'
Below is a key with descriptions of all the features available in the 'By Content' section of your Trust Feedback Strengths dashboard.
| Area | Feature description |
|---|---|
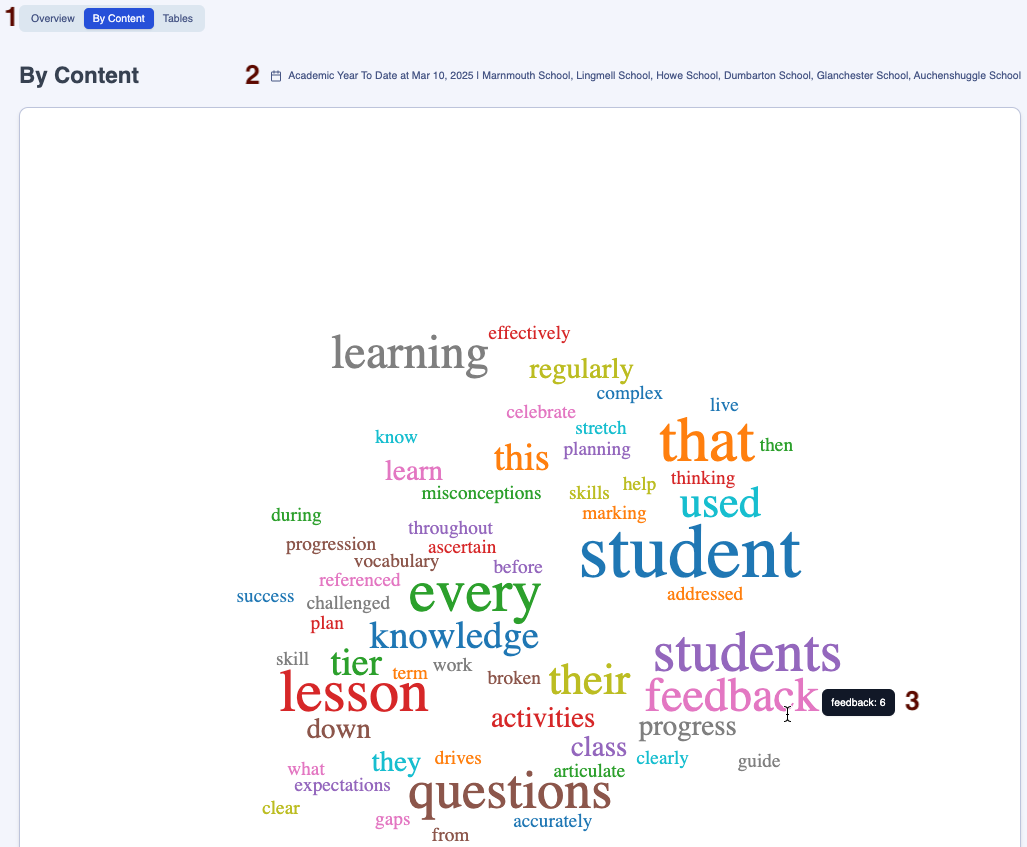
| 1 | 'By Content' is highlighted, indicating that this section of the dashboard relates to the content written in your strengths |
| 2 | This header displays the filters selected |
| 3 | The word cloud displays the words occurring in your teachers' strengths, with the words in the largest font occurring most commonly. Hover over each word to reveal how often it has appeared in your strengths |
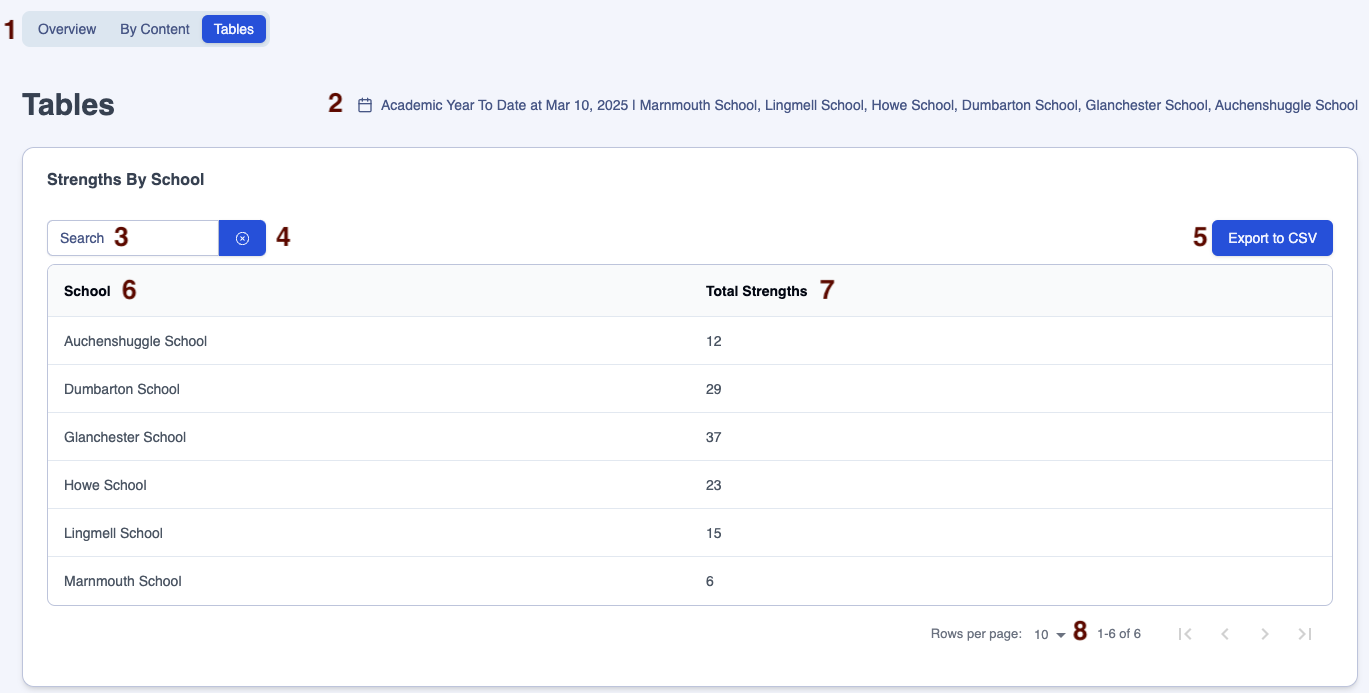
Trust Feedback Strengths dashboard 'Tables'
Strengths By School
Below is a key with descriptions of all the features available in the 'Strengths By School' table in the 'Tables' tab of your Trust Feedback Strengths dashboard.
| Area | Feature description |
|---|---|
| 1 | 'Tables' is highlighted, indicating that this section is displaying a summary table of strengths set, evidenced and completed |
| 2 | This header displays the filters selected |
| 3 | Start typing a School's name in the 'Search' box to filter the table |
| 4 | Click on the 'x' next to the 'Search' box to clear the contents |
| 5 | Click on the 'Export to CSV' button to download the table into spreadsheet format |
| 6 | This column displays all the schools in your selected filters |
| 7 | Click on the 'Total Strengths' column header to sort the count of strengths set by school from lowest to highest, then click again to sort from highest to lowest |
| 8 | Click on the 'Rows per page' dropdown arrow then select 15, 20, 25 or 30 to change the number of rows displayed in the table |
Exporting data from the Trust Feedback Strengths dashboard
There are three ways to export data from your Trust Feedback Strengths dashboard.
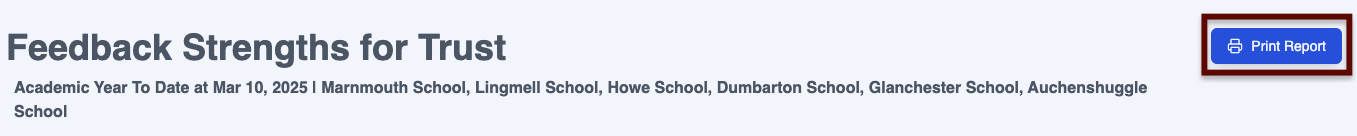
1. Exporting the whole dashboard
Export the whole Trust Feedback Strengths dashboard in PDF format by clicking on the 'Print Report' button on any of the dashboard pages.
2. Exporting graphs
Click on the 'Burger' (the three straight lines) next to any graph to export in SVG (image), PNG (image) or CSV (spreadsheet) format.
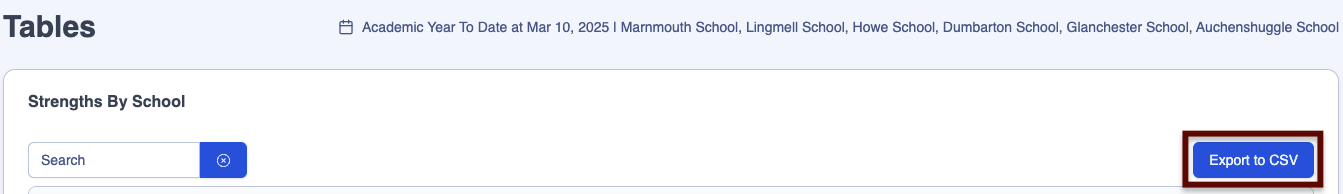
3. Exporting information from Summary Tables
Navigate to Dashboards > Trust Feedback Strengths > Tables then click on the 'Export to CSV' button on the table to download the data in spreadsheet format.
Top tips 💡
Using the 'Overview' tab as a starting point to identify expert practitioners
It is possible that one school in your trust will have an area for development in a particular Habit, whilst this Habit will be an area of strength in another of your schools.
The 'Overview' tab of the Trust Feedback Strengths dashboard can be used as a starting point for trust leaders, firstly to see which schools are regularly recording strengths for their teachers. Using the 'View School Dashboard' button in the 'Overview' tab, you can then drill down into an individual school's data to identify your lead practitioners who will be able to provide support for the other school.
Was this article helpful?