- 3 Minutes to read
- Print
- DarkLight
- PDF
Data analysis for a subject
- 3 Minutes to read
- Print
- DarkLight
- PDF
When a data drop is published, the analysis is available once the Assessment Term date end has passed. Leaders can access subjects to see the analysis and plan appropriate actions to assist students with their learning.
How to access the subject analysis
- Select Subjects from the menu and select the subject area that you want to analyse. You can also select Overview to go to a landing page where you can select the subject from a drop-down list.

Overview of the subject page for all year groups
Accessing the subject area as above will take you into a summary page for all year groups for that subject. A headline of the data for each year group will display allowing for quick comparison.
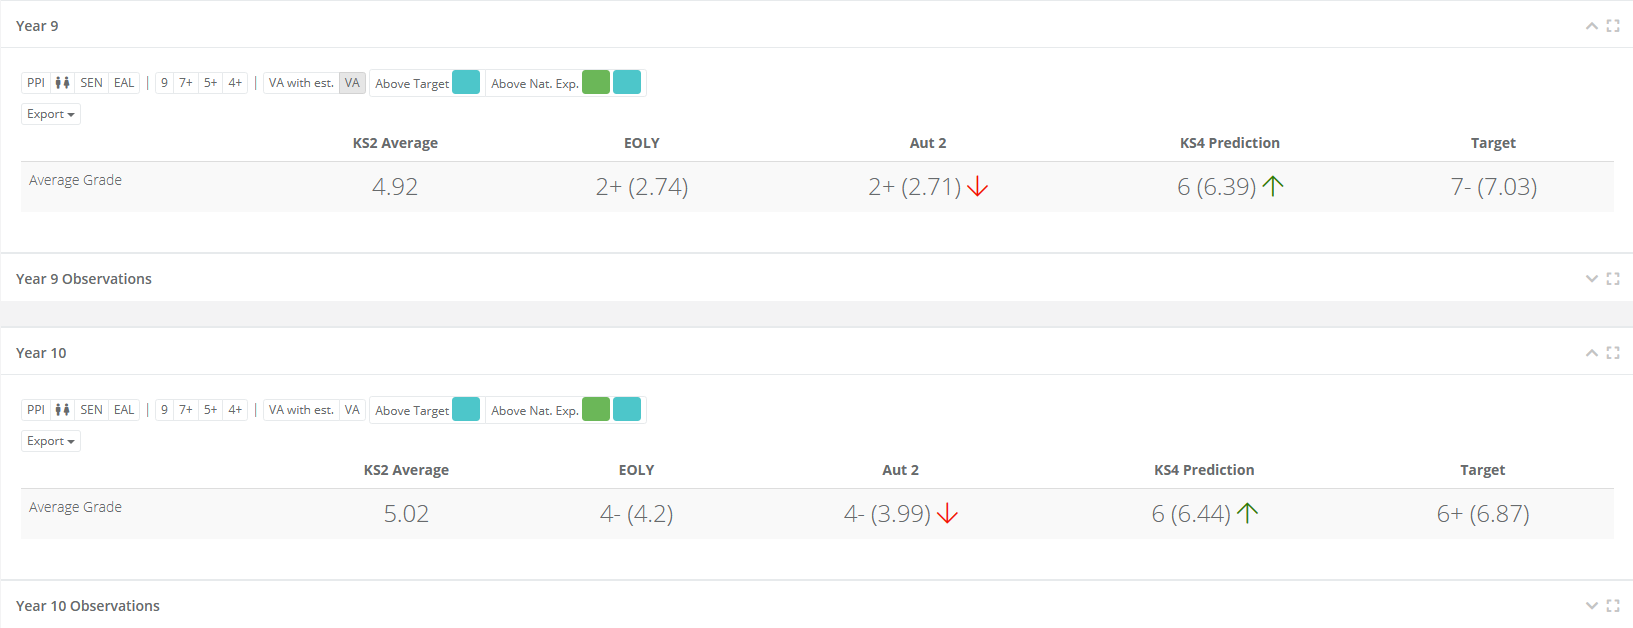
Selecting Observations will expand the heading allowing you to see the data for the subject up against the teaching and learning data.
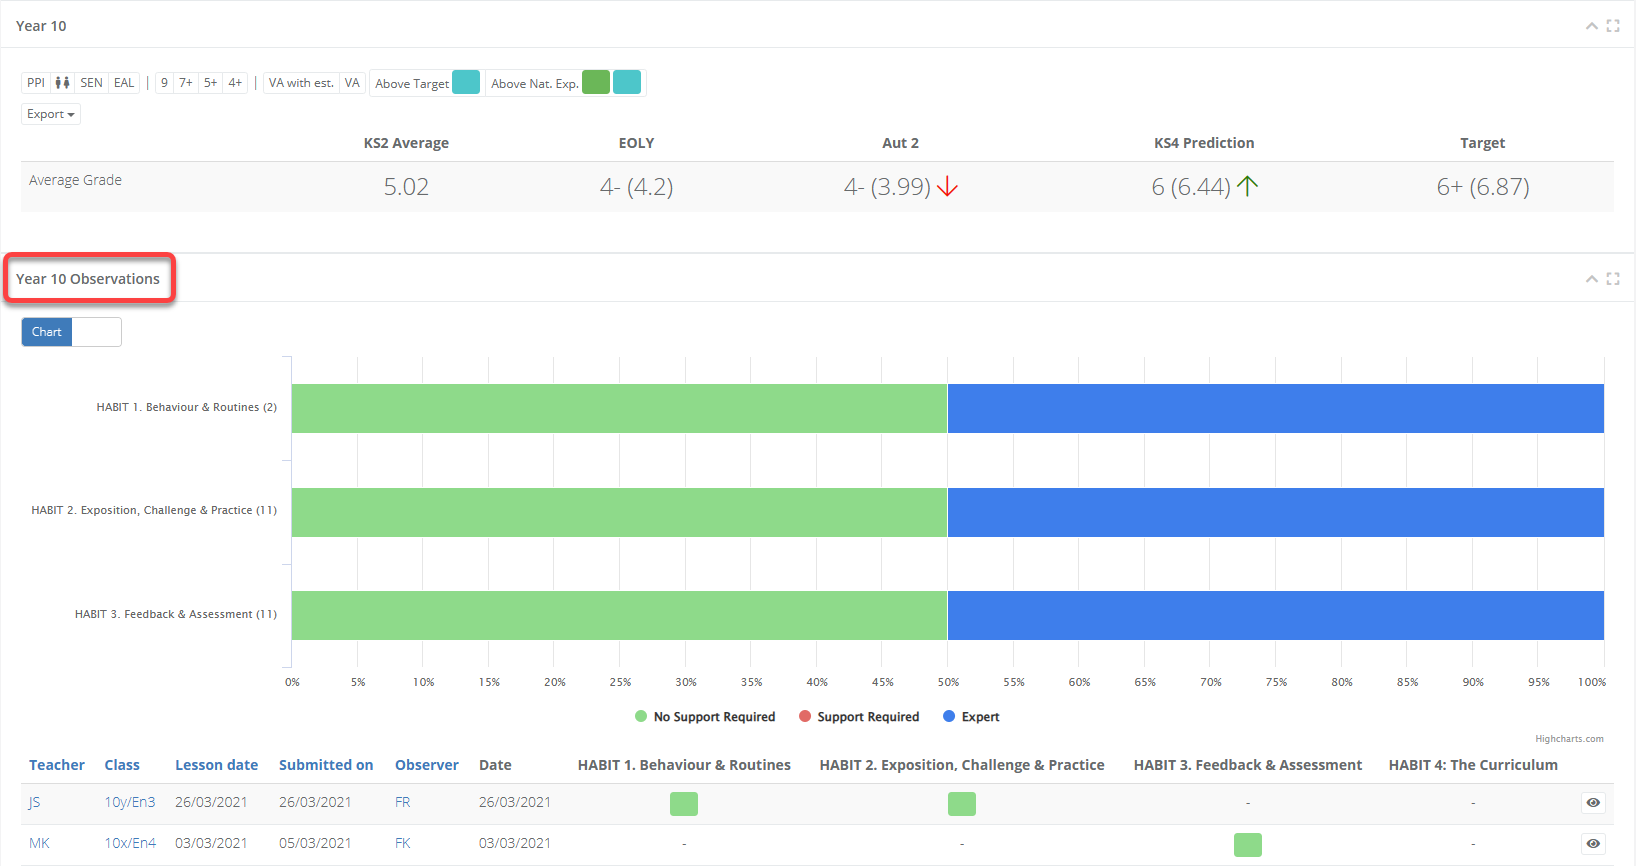
Select a year group from the drop-down at the top of the page to go into the subject analysis for a select year group.

Overview of the subject page for a select year group
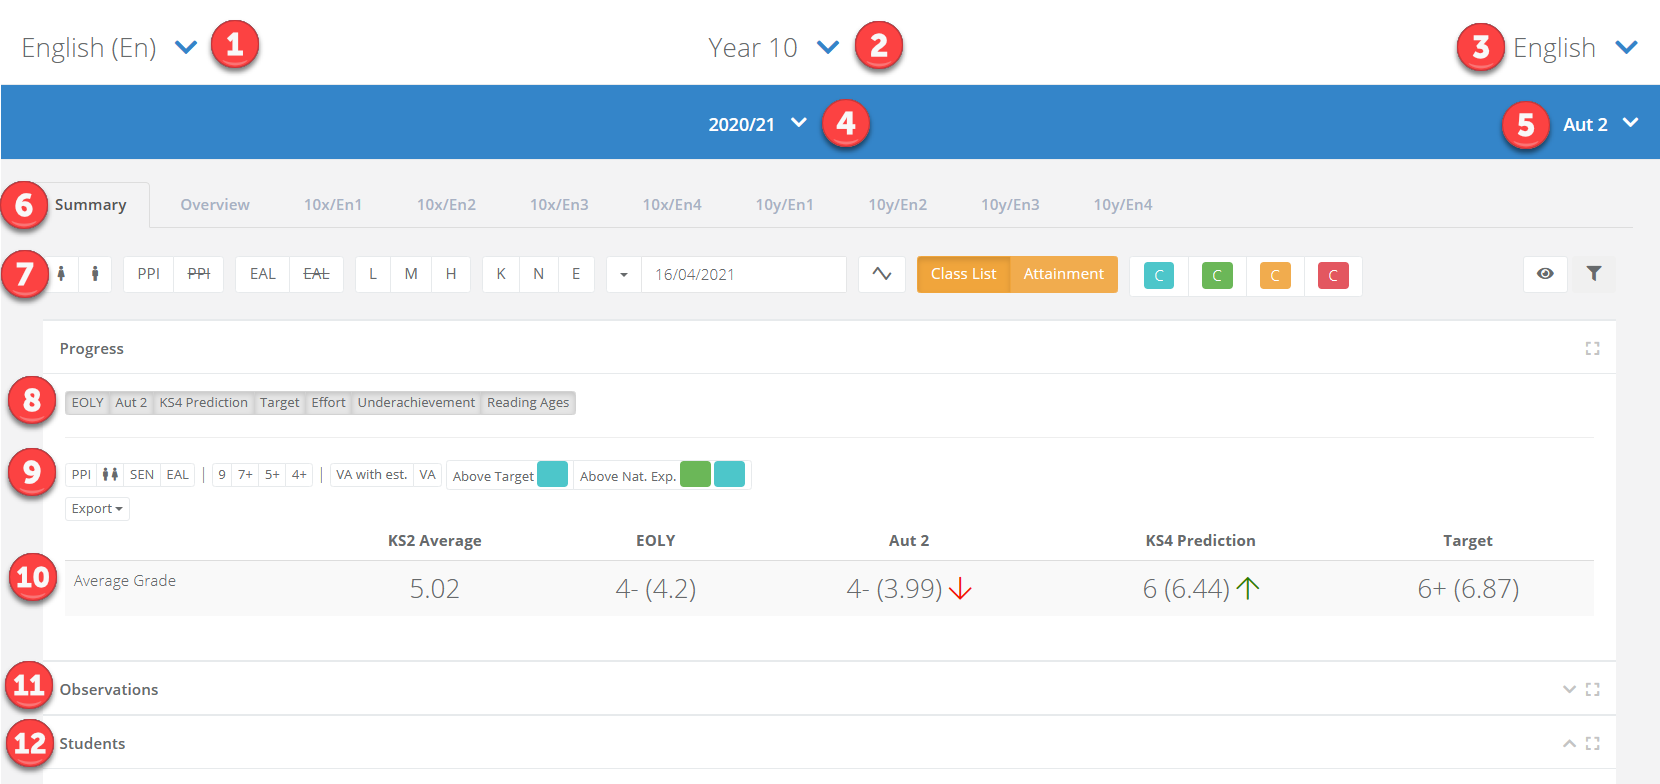
| Area | Description |
|---|---|
| 1 | Subject. |
| 2 | Year group. |
| 3 | Sub-subject (for example, English might be split into Language and Literature). Select this to pick a different sub-subject if available. |
| 4 | Academic year. Select this to pick a different year. |
| 5 | Assessment term. Select this to pick a different term. |
| 6 | The Summary tab will show data for all pupils. The overview tab allows you to compare the data by class. Select a class tab to go into the class analysis. |
| 7 | Filters that can be applied to the data and class list. |
| 8 | Column selector. Select them to hide or show that data on the page. |
| 9 | Comparators. Select them to hide or show comparative statistics on each data point. |
| 10 | Summary of the subject data. |
| 11 | Observations that have been recorded for the class (available to permissioned users). |
| 12 | Student list. Select the heading to expand it. |
How to filter and analyse data
Student list
The Student area shows the students and their data. Icons next to student names show key information such as gender, PPI (denoted by a P), EAL (denoted by a globe icon), and SEN code (K or E).
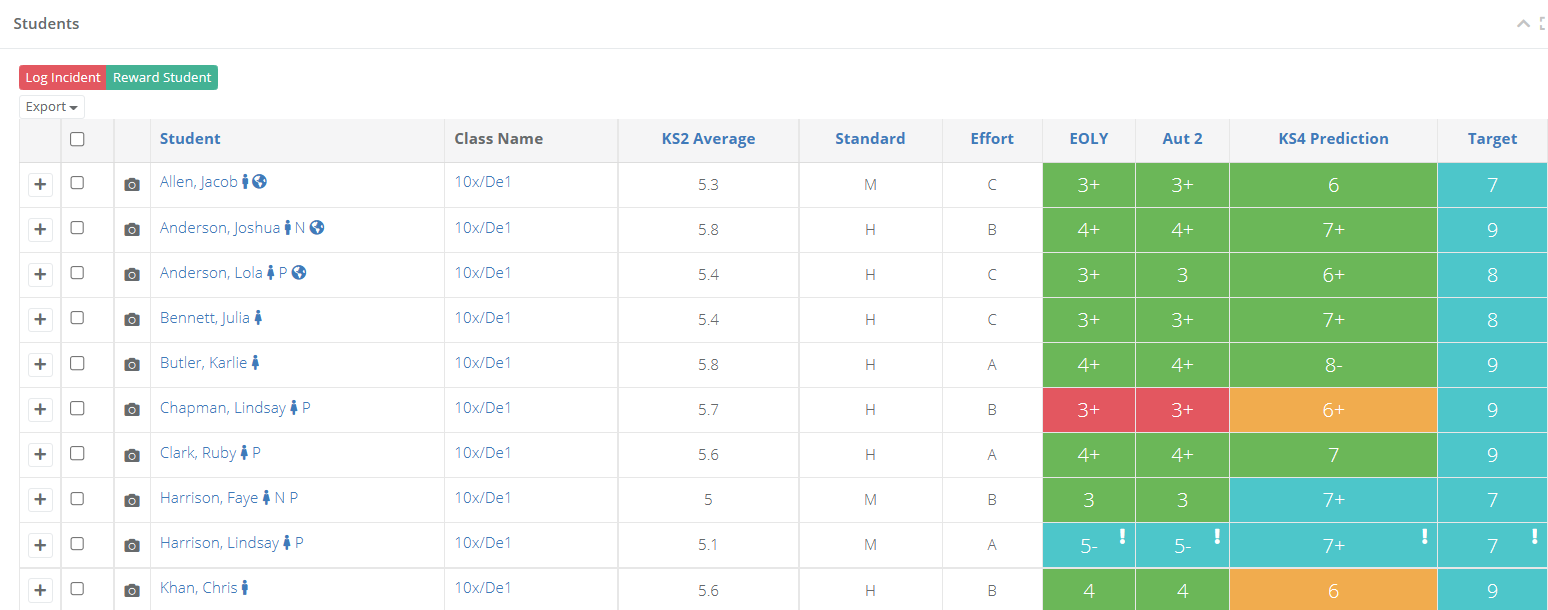
Selecting a column title will order the data for that column.
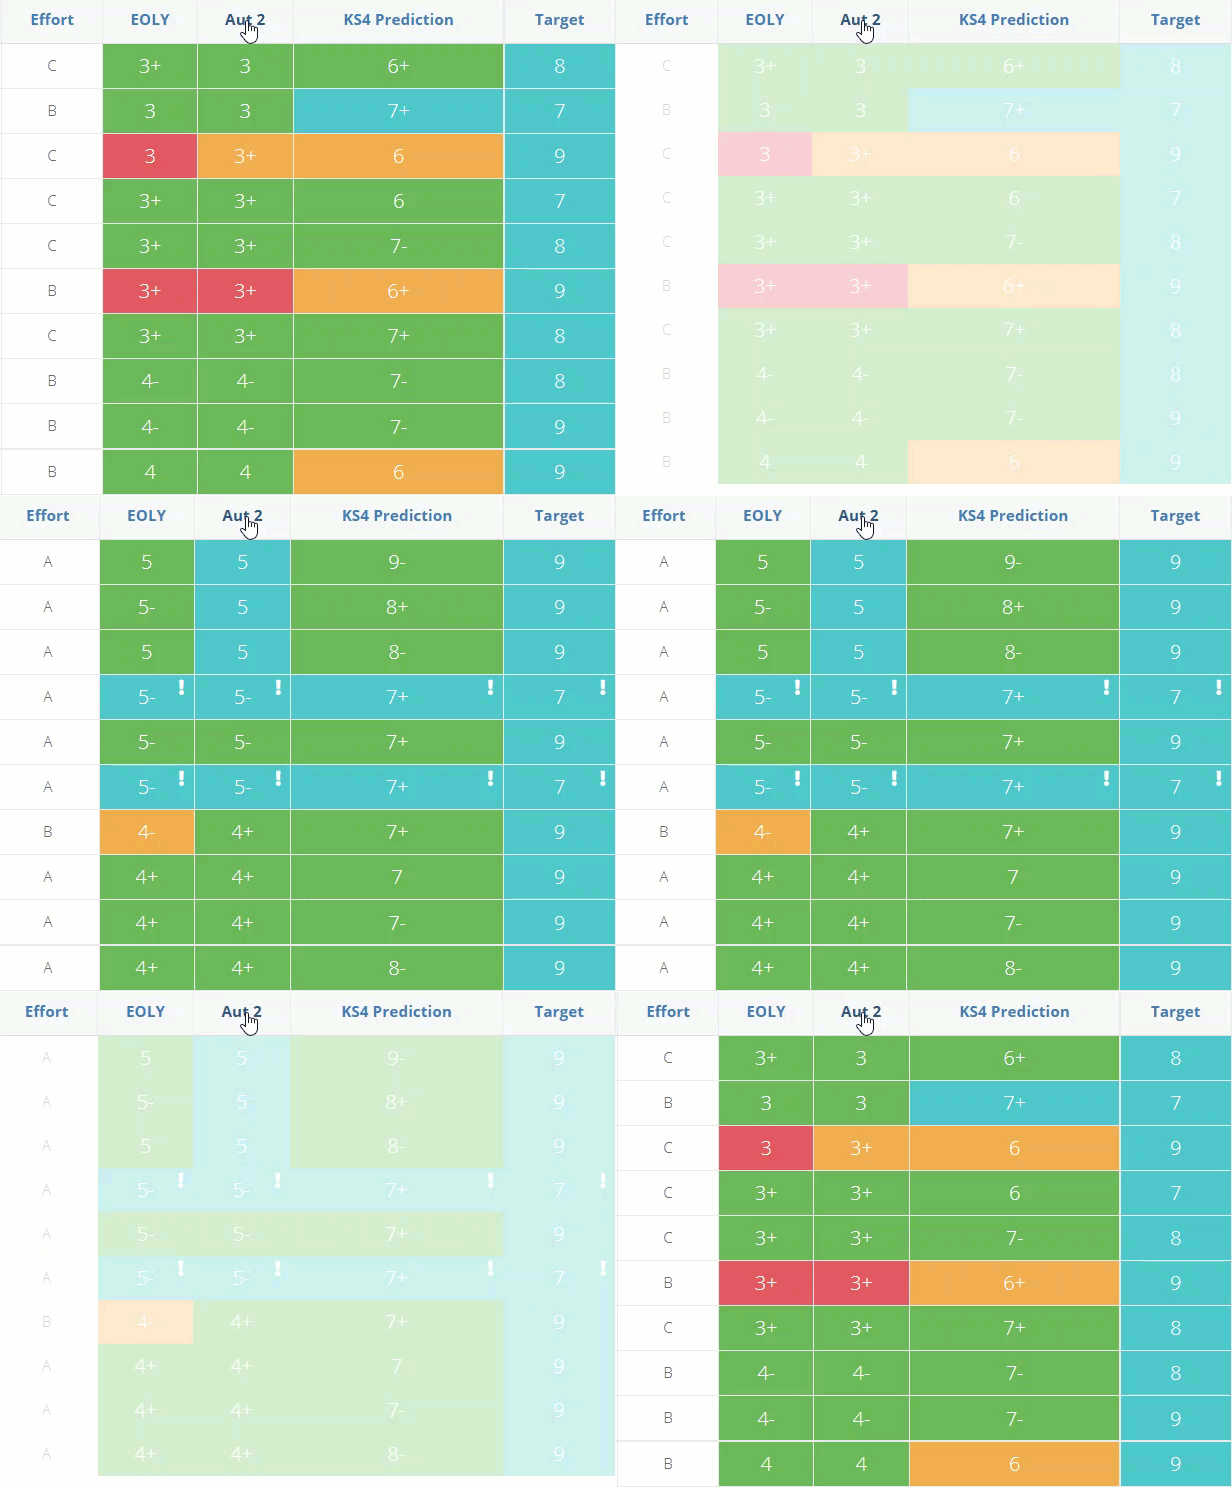
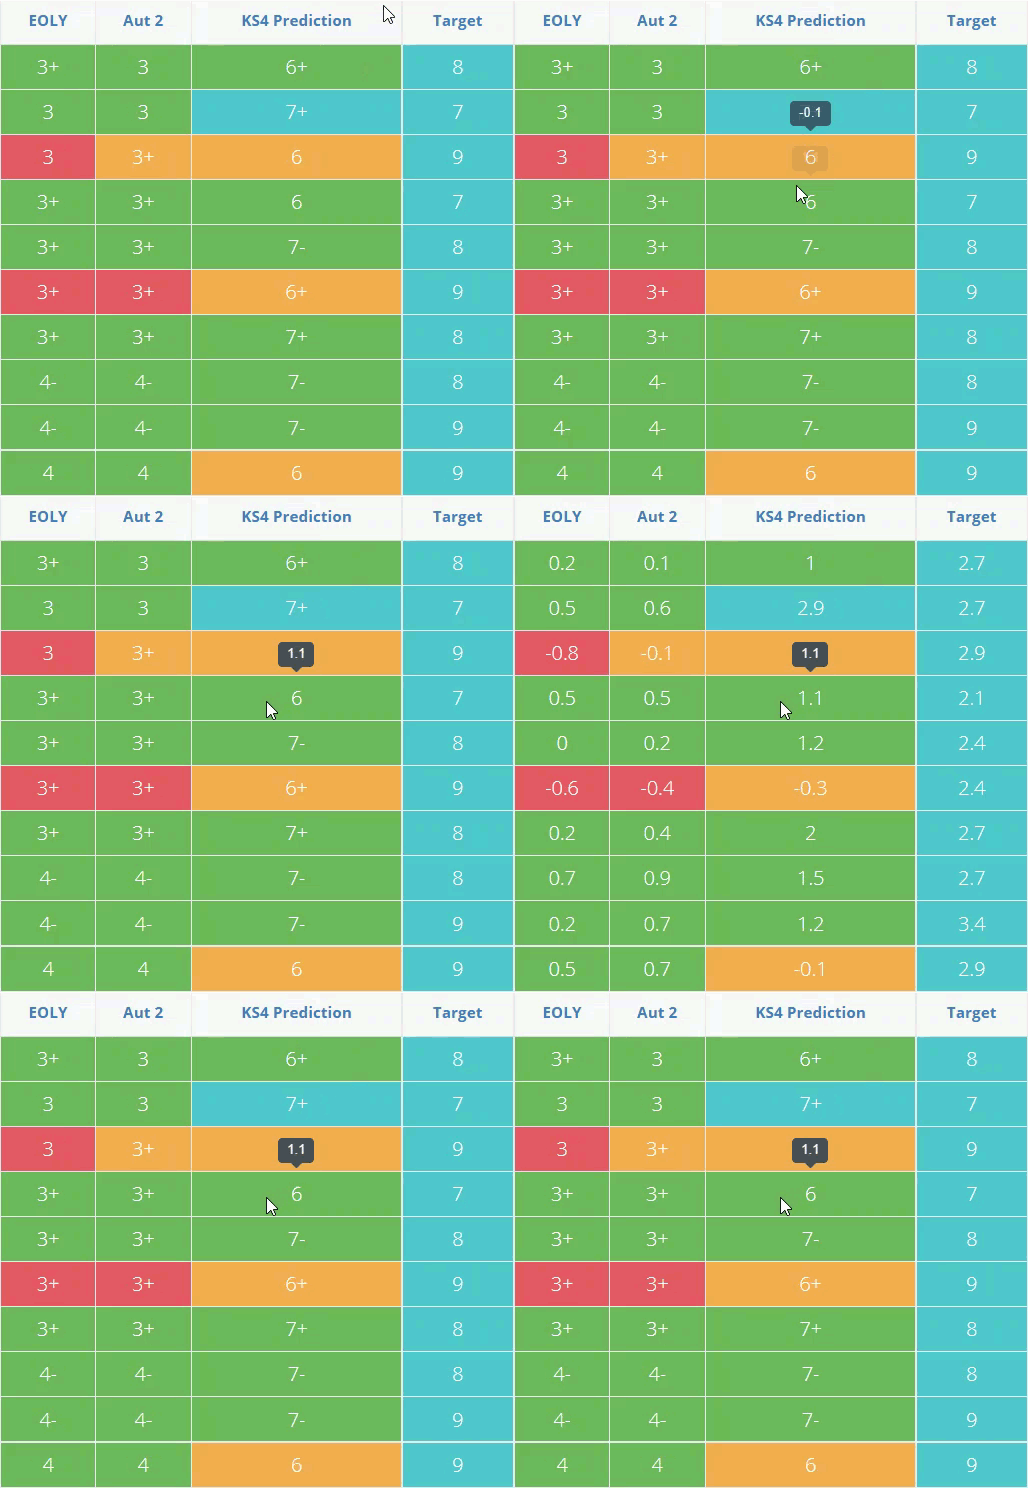
Hovering your mouse over a grade will show you the VA for the grade. Selecting the grade will also change the display of all the data to show you the VA scores.
An exclamation mark next to a grade indicates that the student does not have validated KS2 data.
Class overview
- Selecting the Overview tab from the top of the page allows you to see a class-by-class comparison of the data.
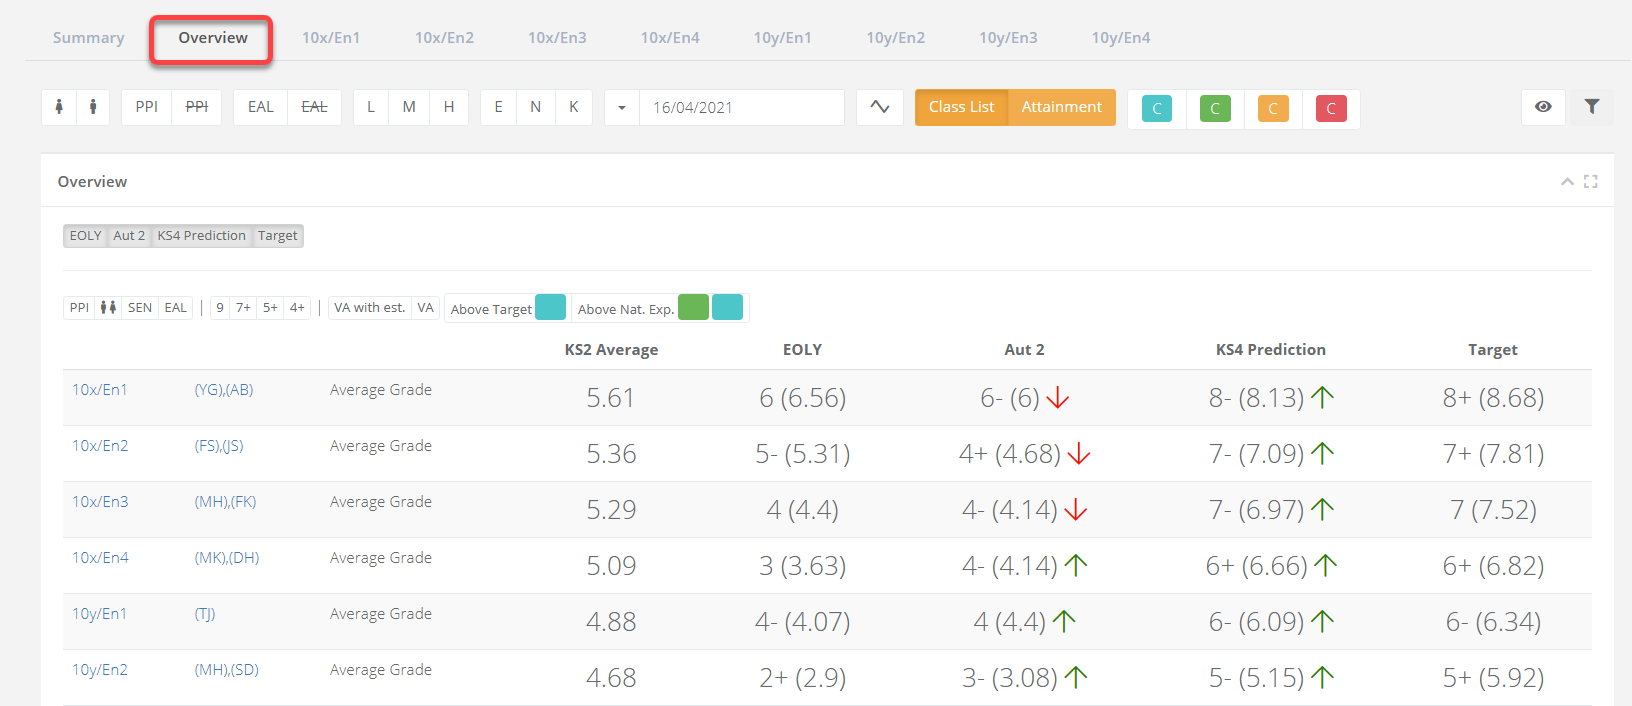
Column selector
- The available pieces of data for the class (i.e. Current, Predicted, ATL) will display as options to select and deselect in the Summary area. You can toggle these on or off.

Subject summary
The Summary will display the average data for the class across each assessment term, as well as the average prediction, target, and KS2 grade.

The number in brackets next to each grade shows the numerical average behind it.
The arrows next to the data will point up or down depending on whether the average is higher or lower compared to the current grade average that the class achieved at the end of the previous academic year. Hovering your mouse over the arrow will display the difference.
Comparators
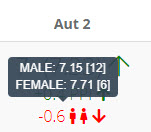
This row of options in the Summary allows you to add additional lines which compare the data between key groups such as gender, pupil premium, and more. These additional lines will show the differential within the selected key groups.

Hovering your cursor over this will show the average grade value for each group as well as the number of students in brackets.
To see the VA of the summary data, select VA in the comparators.

Filters
There are various filters at the top that can be applied to the data allowing you to filter for Pupil Premium, Gender, EAL, SEN status, Prior Key Stage Attainment, Ethnicity, and more.

Select the eye icon to see more filters. Once you've chosen your filters, select the filter icon to refresh the data.

