Data analysis for KS4
- 4 Minutes to read
- Print
- DarkLight
- PDF
Data analysis for KS4
- 4 Minutes to read
- Print
- DarkLight
- PDF
Article summary
Did you find this summary helpful?
Thank you for your feedback!
There are four main analysis pages for KS4:
Progress 8 Report - allows you to analyse the Progress 8 of the data.
Progress 8 Broadsheet - allows you to analyse the Progress 8 of the data in a broadsheet export.
Progress 8 Student Report - allows you to analyse the Progress 8 of the data by student.
Subject Summary Student Report - allows you to analyse the data by student.
Progress 8 Report
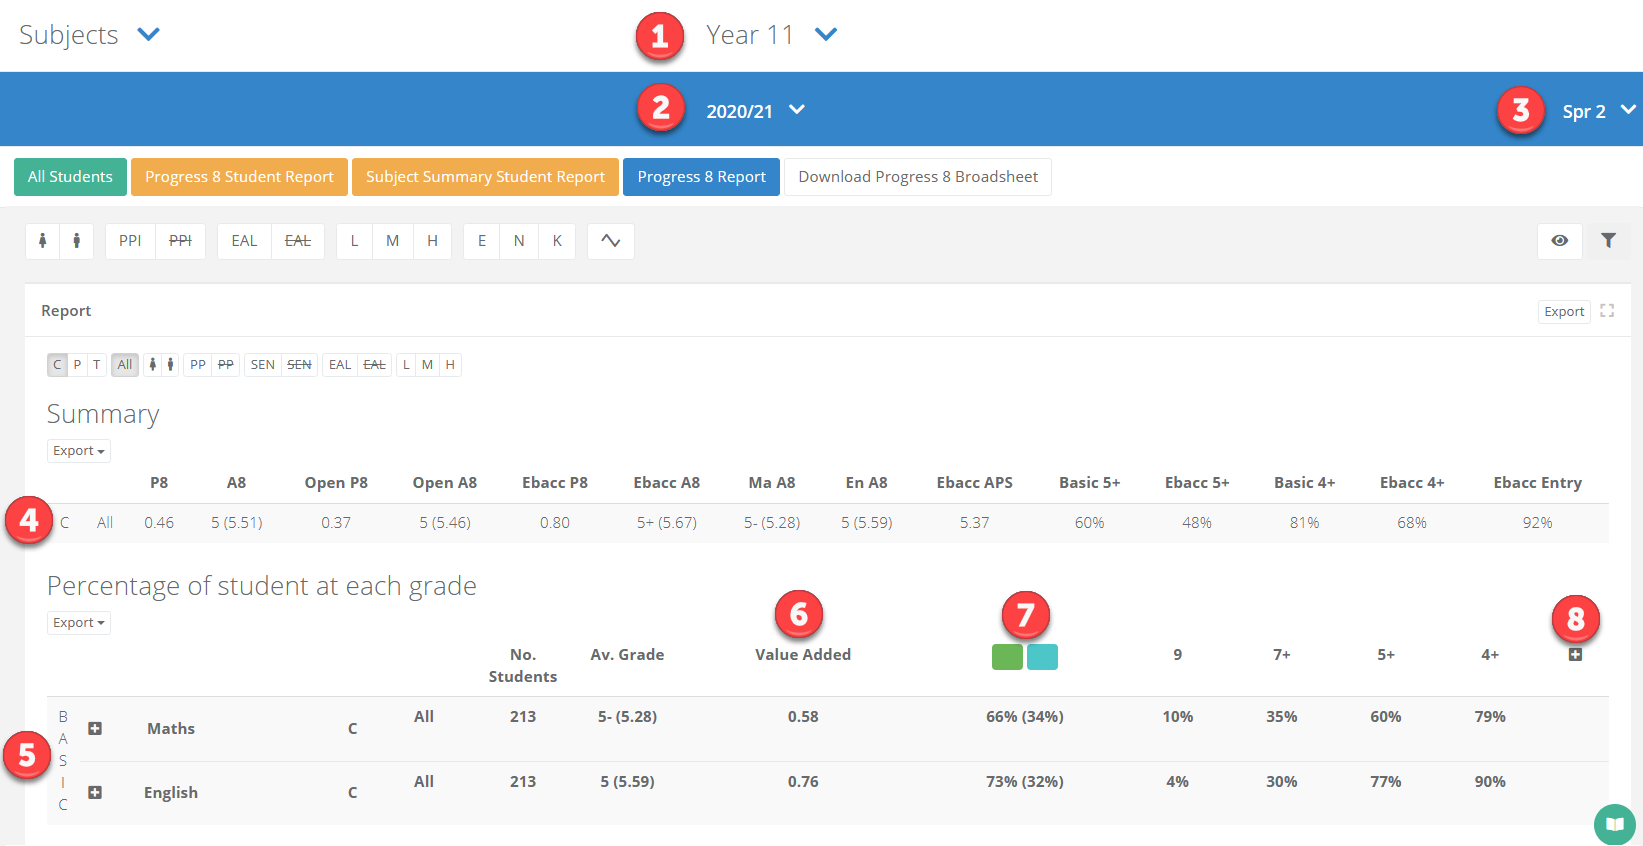
- Select Year Groups from the menu and select the year group that you want to look at. You will be taken into the Progress 8 Report for that year group. Any P8 calculations here will exclude students without validated KS2 data.
| Area | Description |
|---|---|
| 1 | The year group. |
| 2 | The academic year. |
| 3 | The assessment term. |
| 4 | The headline data. |
| 5 | The subject data is grouped into buckets from this point on. Selecting the plus icon for a bucket will display all of the subjects within, for example Language and Literature within English. Bold rows display data for all students in the year group, while other rows display data for students taking that subject. |
| 6 | The Value Added is the 'Progress 8 score' for that subject. |
| 7 | The green is the percentage of students on or above expectation, the blue is the percentage of students on or above target. |
| 8 | The plus icon can be selected to see a grade breakdown by percentage. |
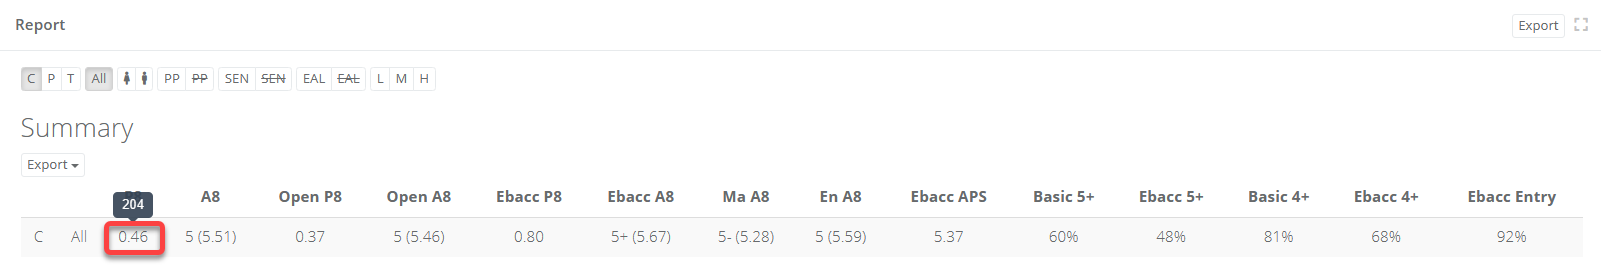
Hovering your mouse over a figure will show the number of students.
How to filter and compare data
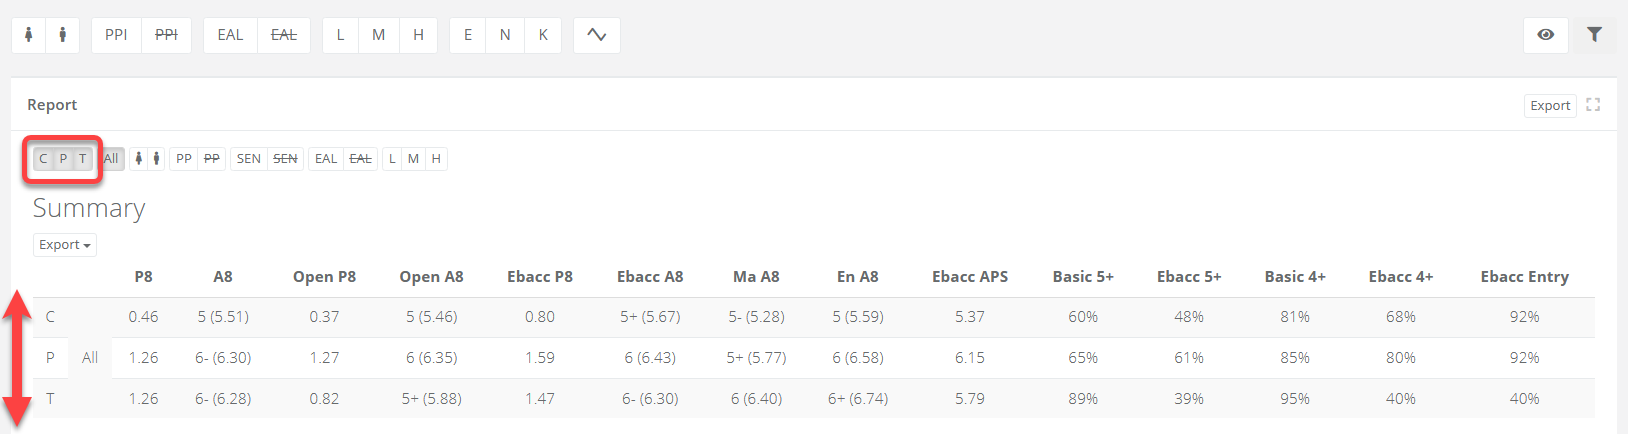
The line directly above the table contains icons representing attainment types (C means Current, P means Predicted, T means Target), as well as key student groups such as gender, Pupil Premium, and SEN. You can select these icons to see the data side-by-side.
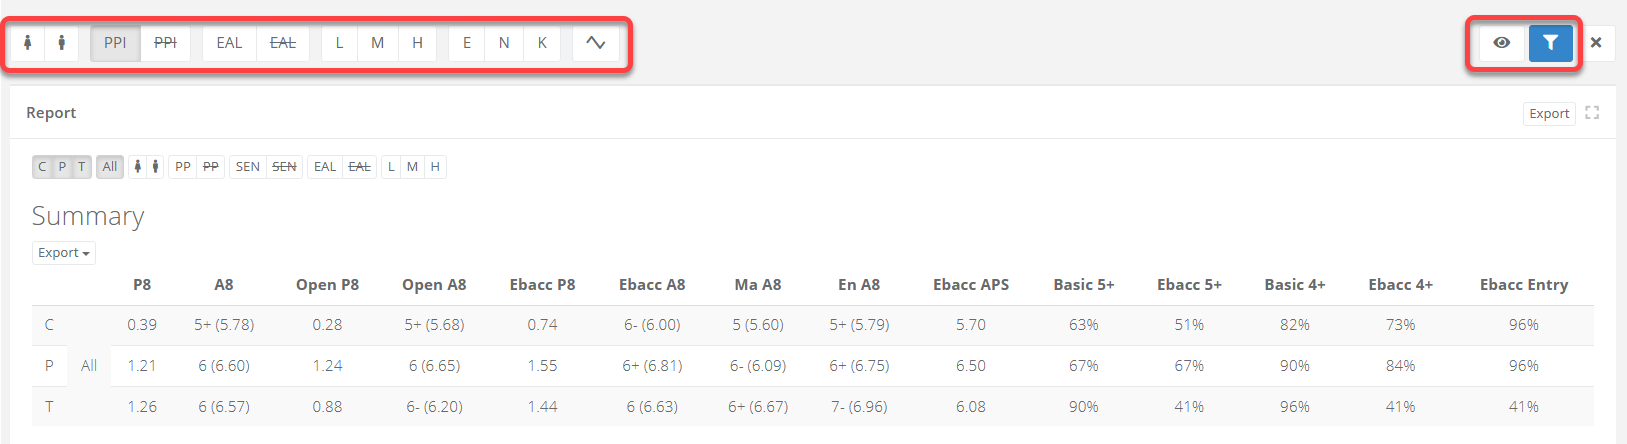
You can also filter the page using the options at the top. Selecting the eye icon will display additional filters. Once you have made your selection, click the blue filter icon to refresh the data.
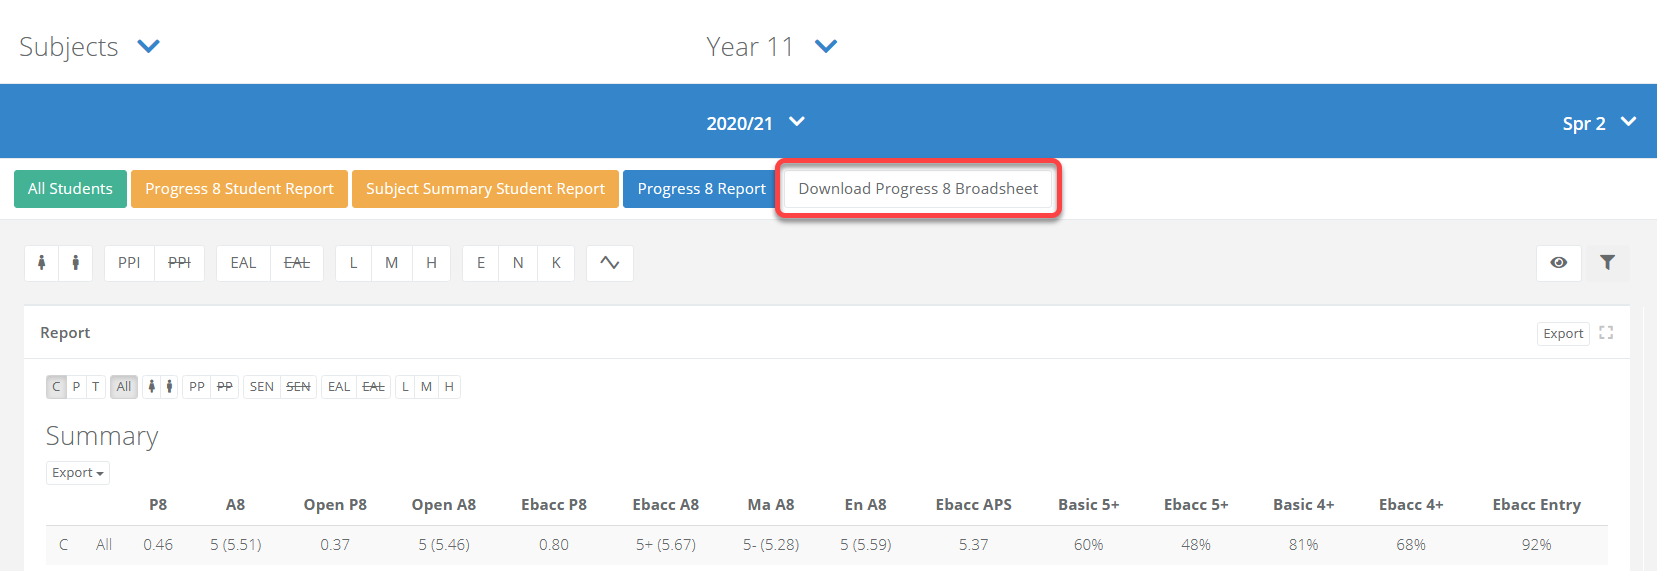
Progress 8 Broadsheet
Select Year Groups from the menu and select the year group that want to look at. You will be taken into the Progress 8 Report for that year group. Select Download Progress 8 Broadsheet.
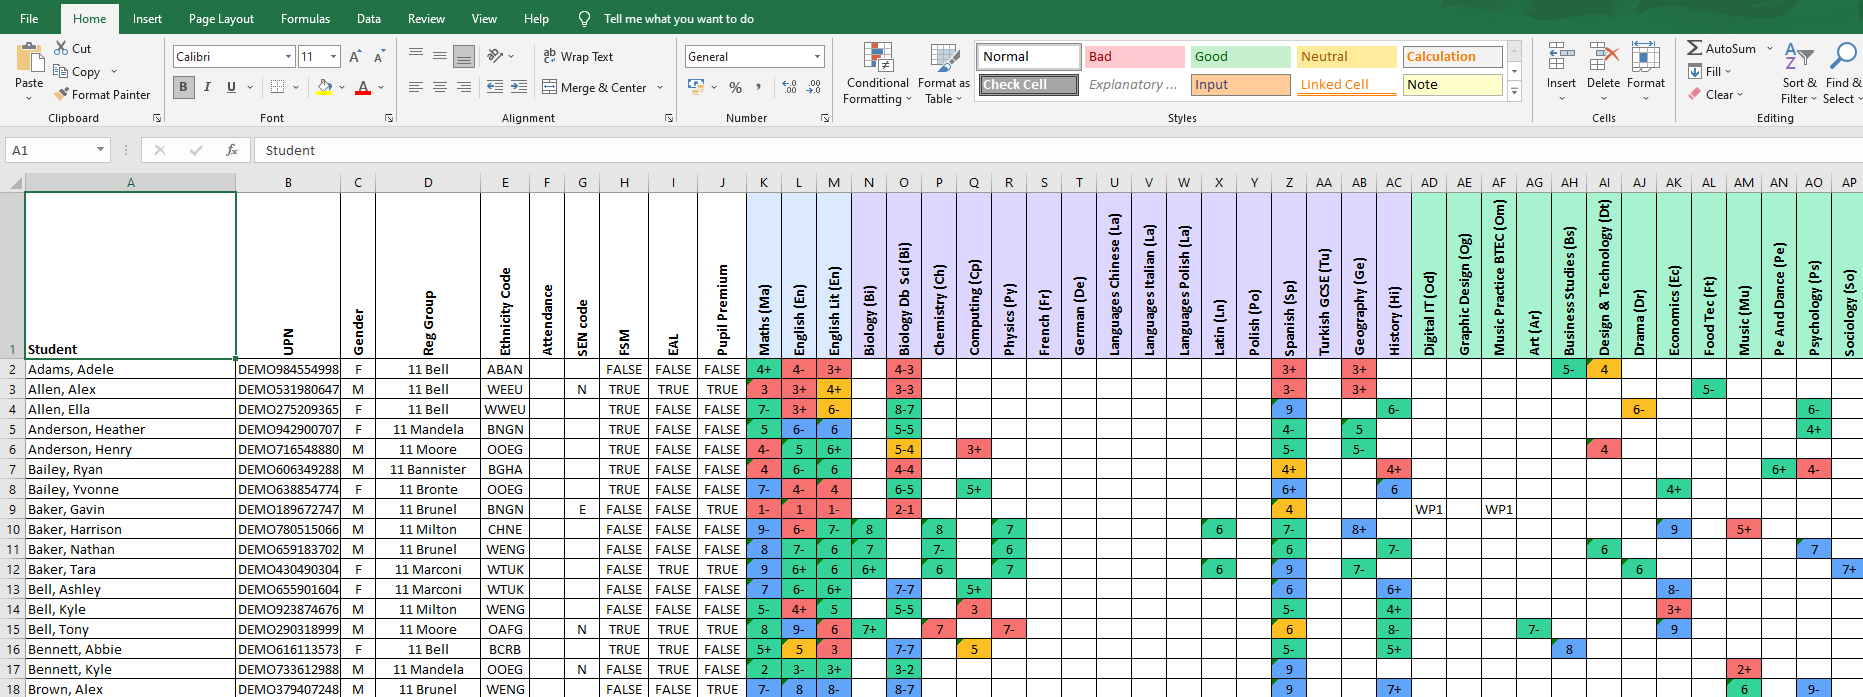
The broadsheet will generate an Excel file with several sheets allowing you to navigate between current and predicted attainment grades or VA (i.e. Progress 8).
Progress 8 Student Report
- Select Year Groups from the menu and select the year group that want to look at. You will be taken into the Subject Summary Report for that year group. Select the orange option for Progress 8 Student Report from the page.
| Area | Description |
|---|---|
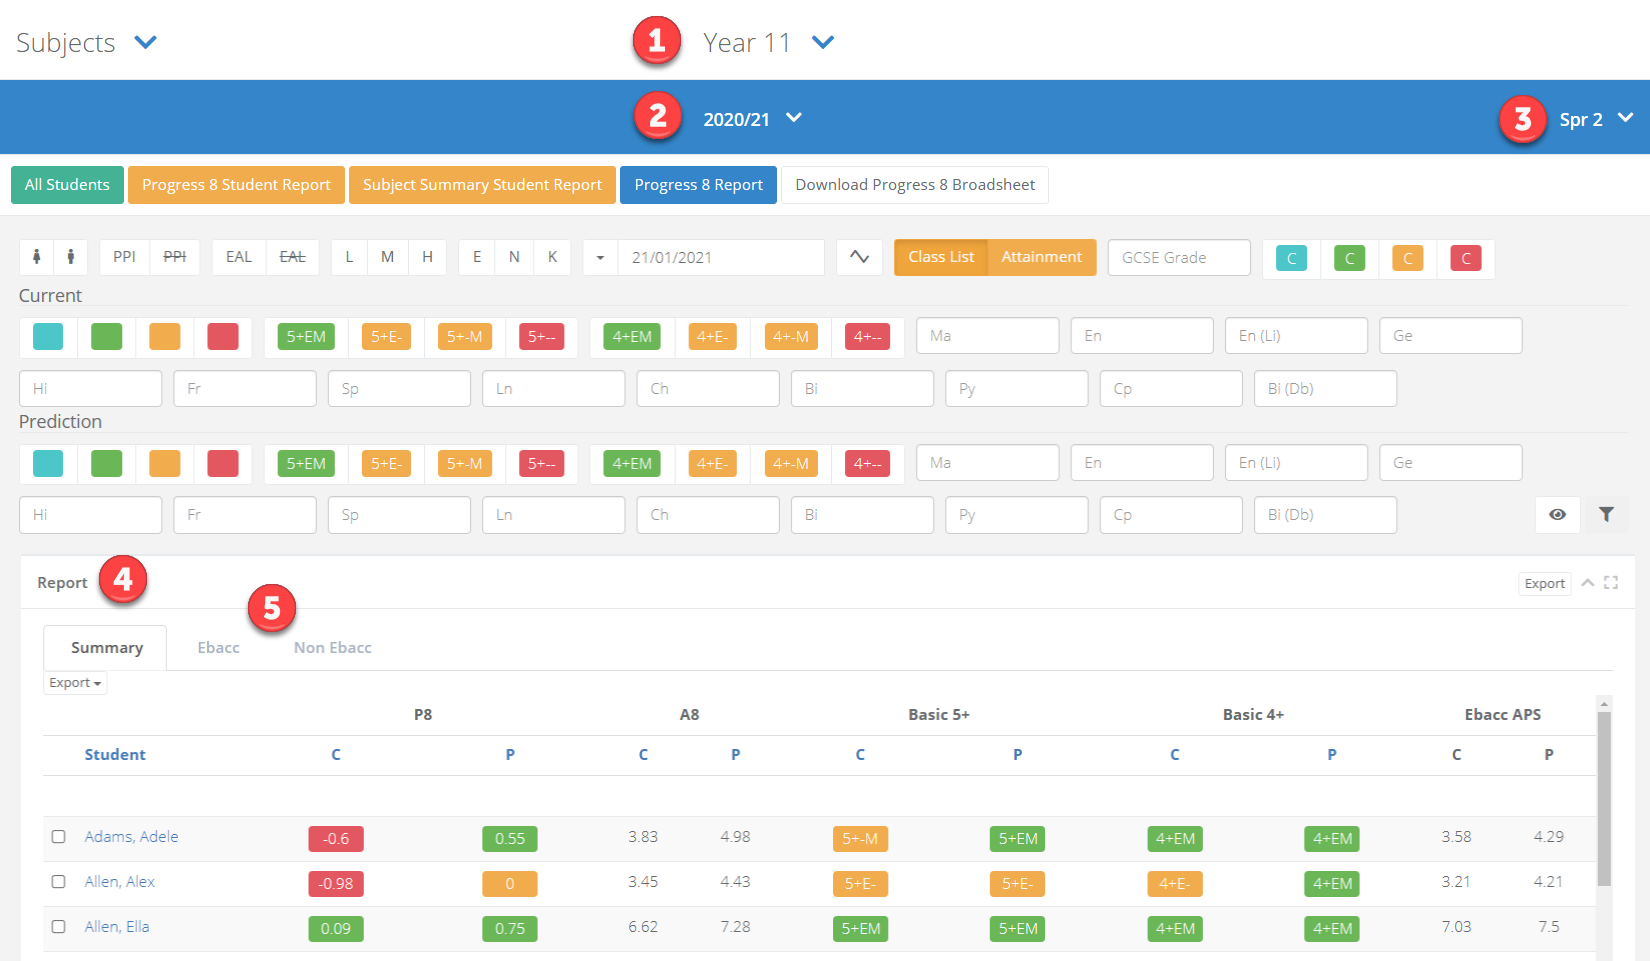
| 1 | The year group. |
| 2 | The academic year. |
| 3 | The assessment term. |
| 4 | The data report showing students down the left. The columns will show Current and Predicted Progress 8, Attainment 8, and whether the student is achieving 5 or 4 in English and Maths. |
| 5 | Select Ebacc or Non Ebacc will show you the Progress 8 by student for the subjects in those areas. |
Selecting either the C or P for a column will allow you to sort the data to identify high performers or students in need of intervention, as shown in the screenshot below.
How to filter and compare data
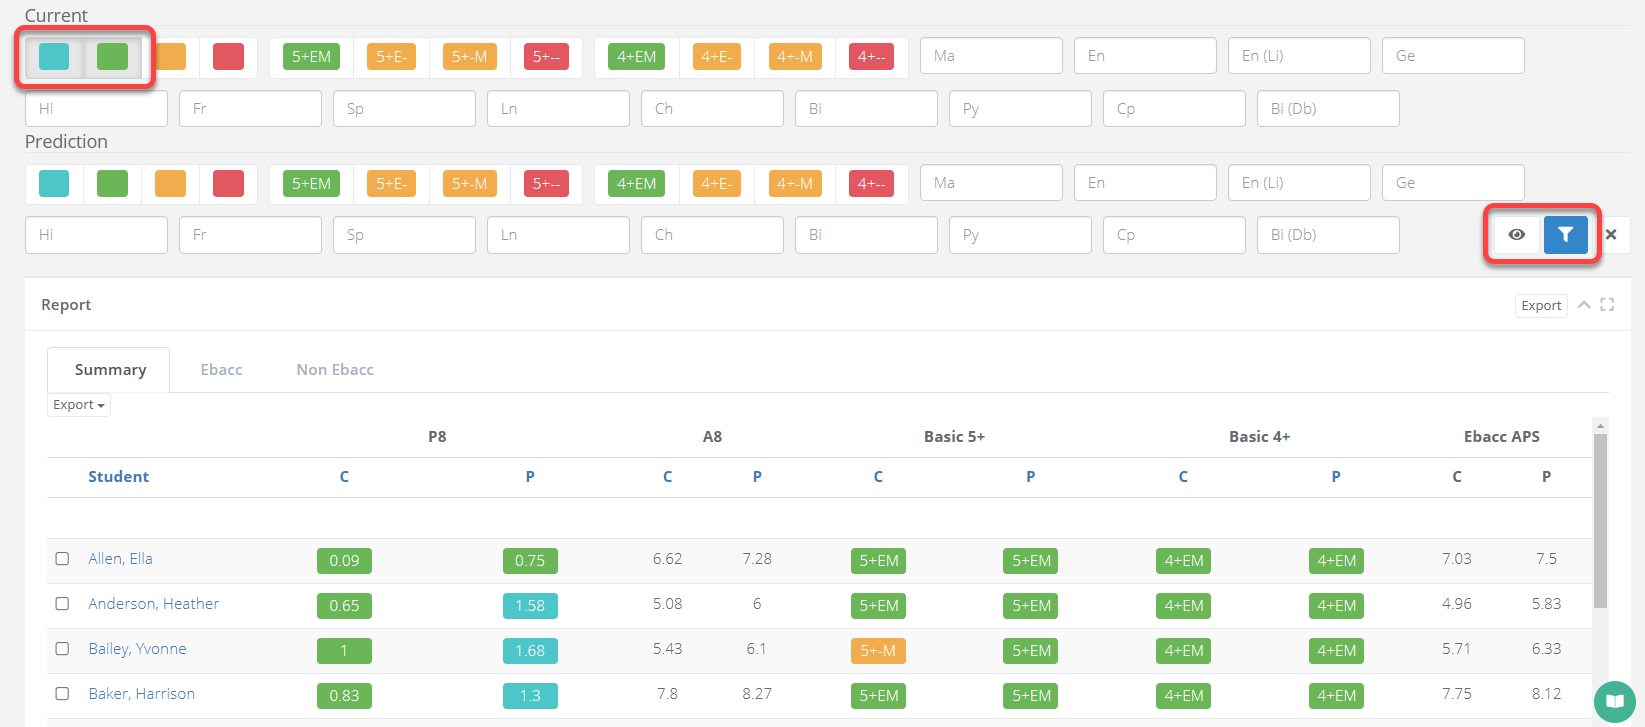
You can filter the page using the options at the top. Selecting the eye icon will display additional filters. Once you have made your selection, click the blue filter icon to refresh the data.
This allows you to easily identify key groups such as high performers, as shown in the screenshot below.
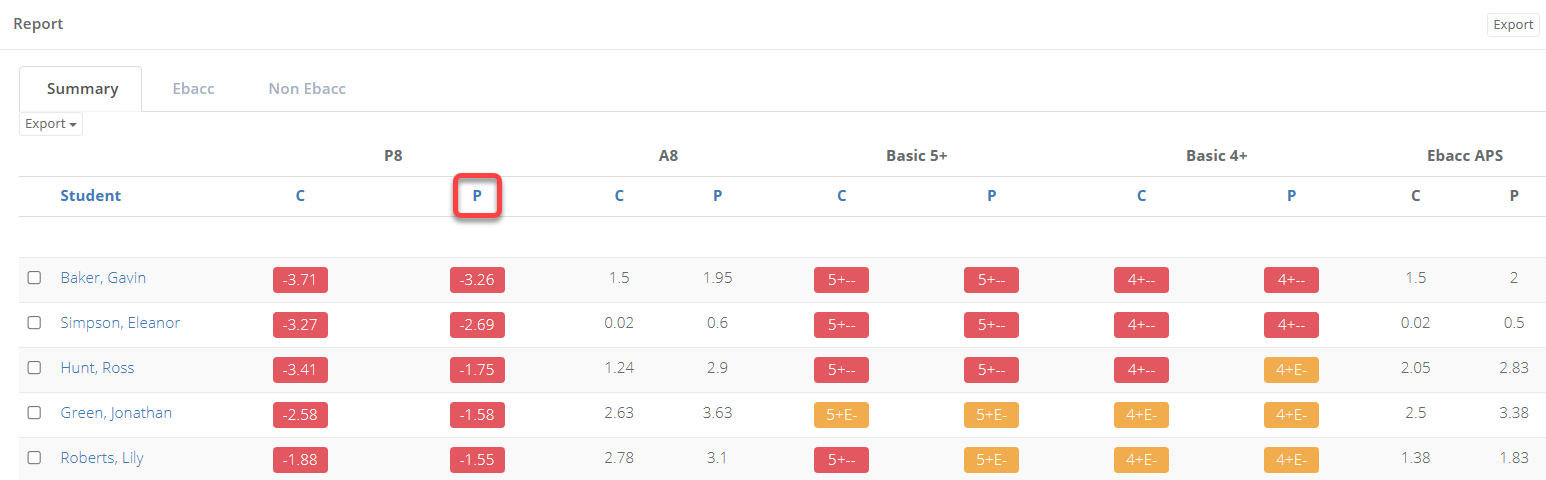
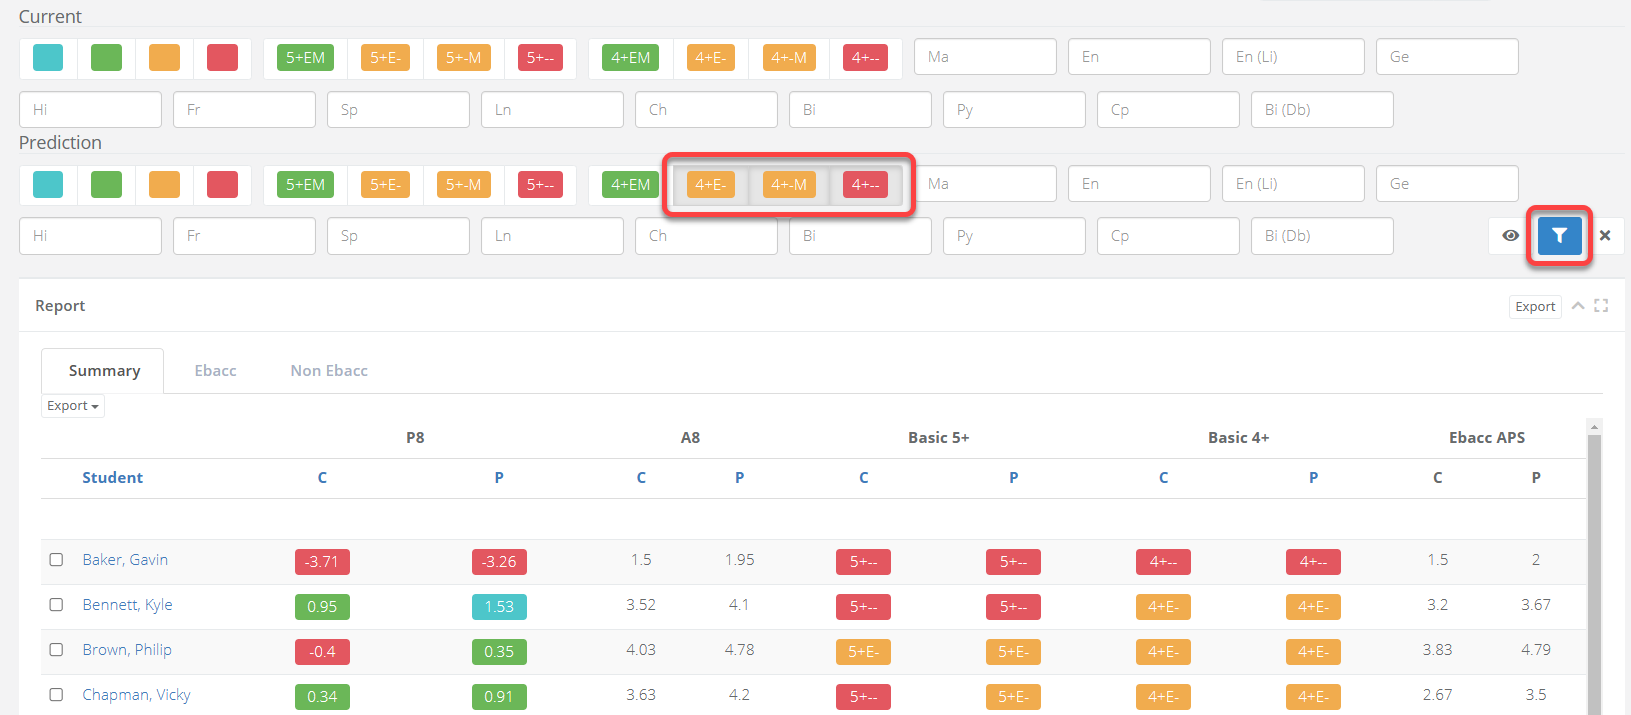
You can also identify students in need of intervention, such as those not predicted to attain a 4 in either English, Maths, or both, as shown in the screenshot below.
Selecting either the C or P for a column will allow you to sort the data to identify high performers or students in need of intervention, as shown in the screenshot below.
Subject Summary Student Report
- Select Year Groups from the menu and select the year group that want to look at. You will be taken into the Subject Summary Report for that year group. Select the orange option for Subject Summary Student Report from the page.
| Area | Description |
|---|---|
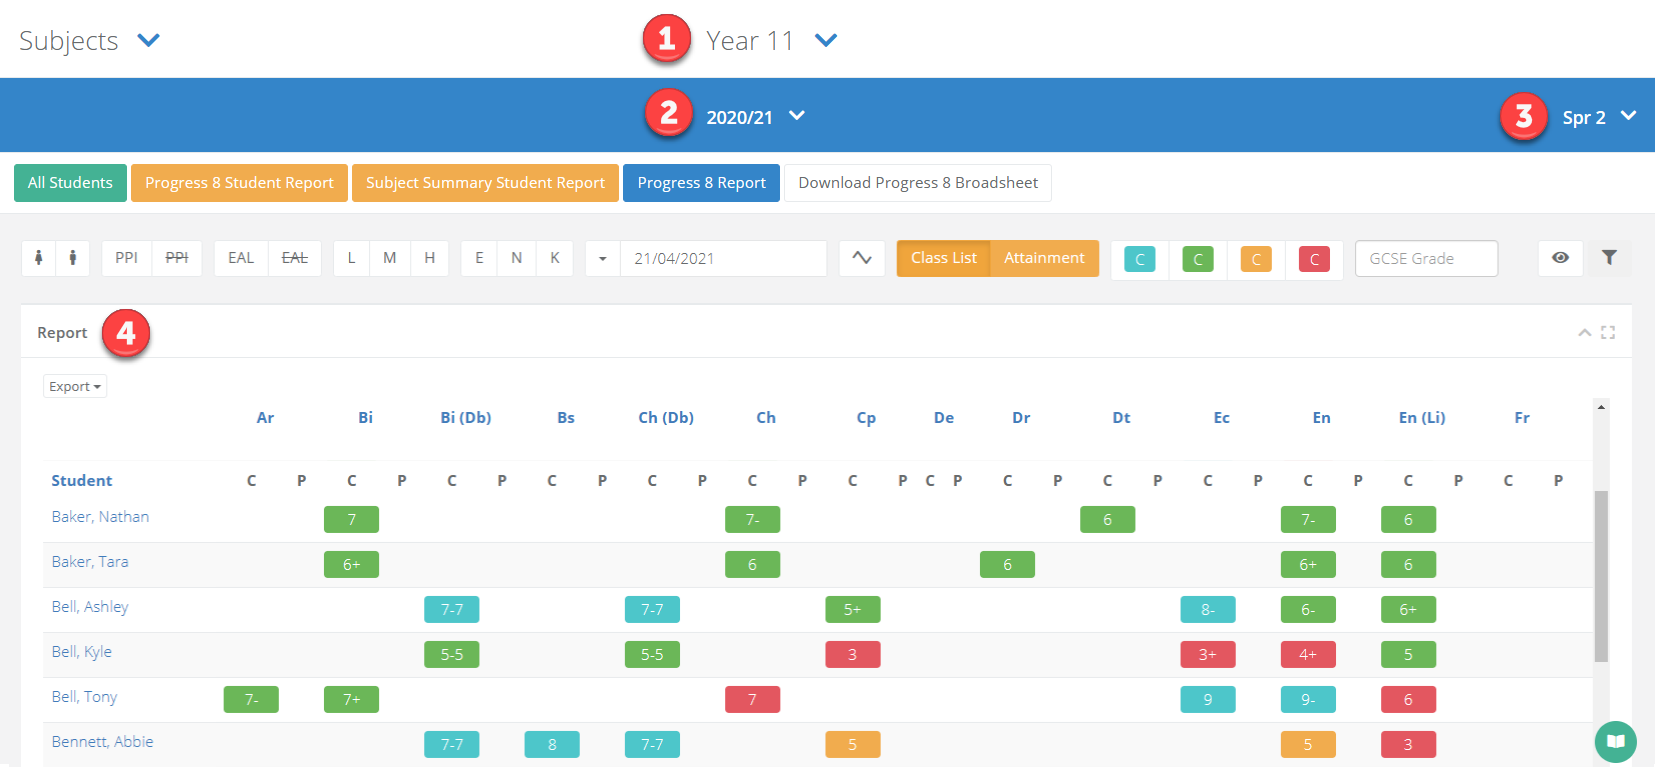
| 1 | The year group. |
| 2 | The academic year. |
| 3 | The assessment term. |
| 4 | The data report showing students down the left. Each subject will display the current and predicted data side-by-side. |
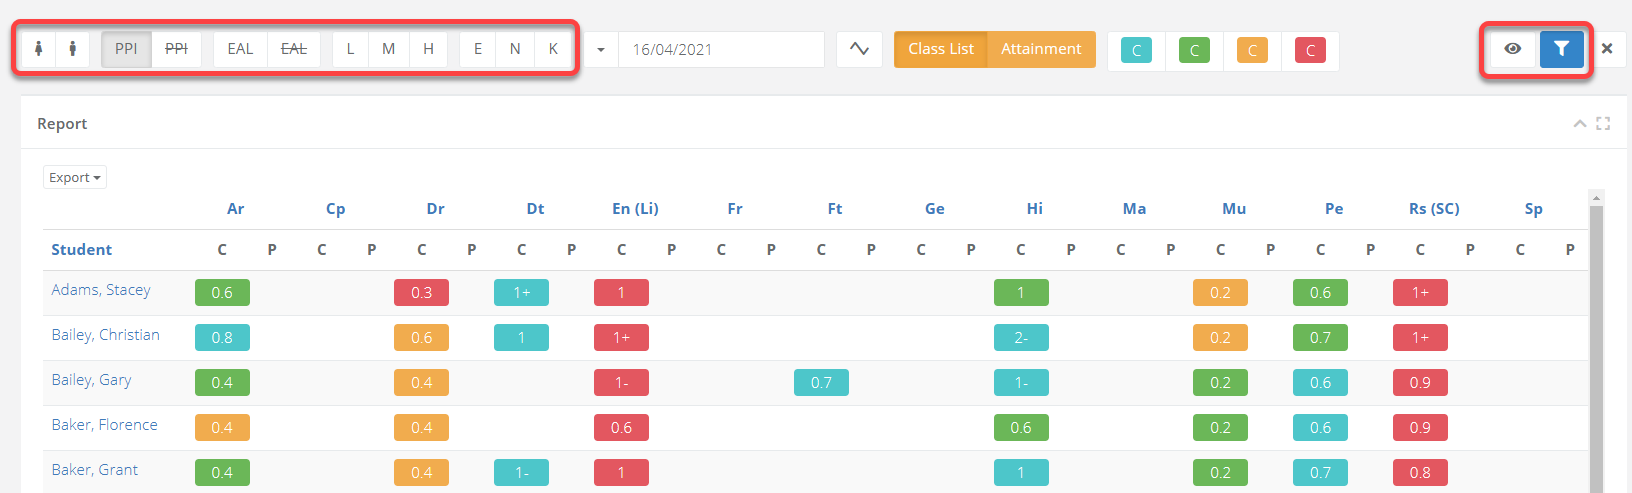
How to filter and compare data
You can filter the page using the options at the top. Selecting the eye icon will display additional filters. Once you have made your selection, click the blue filter icon to refresh the data.
Full training session on data analysis for secondary teachers
This training video gives a full explanation of all the functionality available for secondary teachers to analyse their class data.
Was this article helpful?