- 1 Minute to read
- Print
- DarkLight
- PDF
Data analysis for KS5
- 1 Minute to read
- Print
- DarkLight
- PDF
There are two main analysis pages for KS5:
- Subject Summary Report - allows you to analyse the data by subject.
- Subject Summary Student Report - allows you to analyse the data by student.
Subject Summary Report
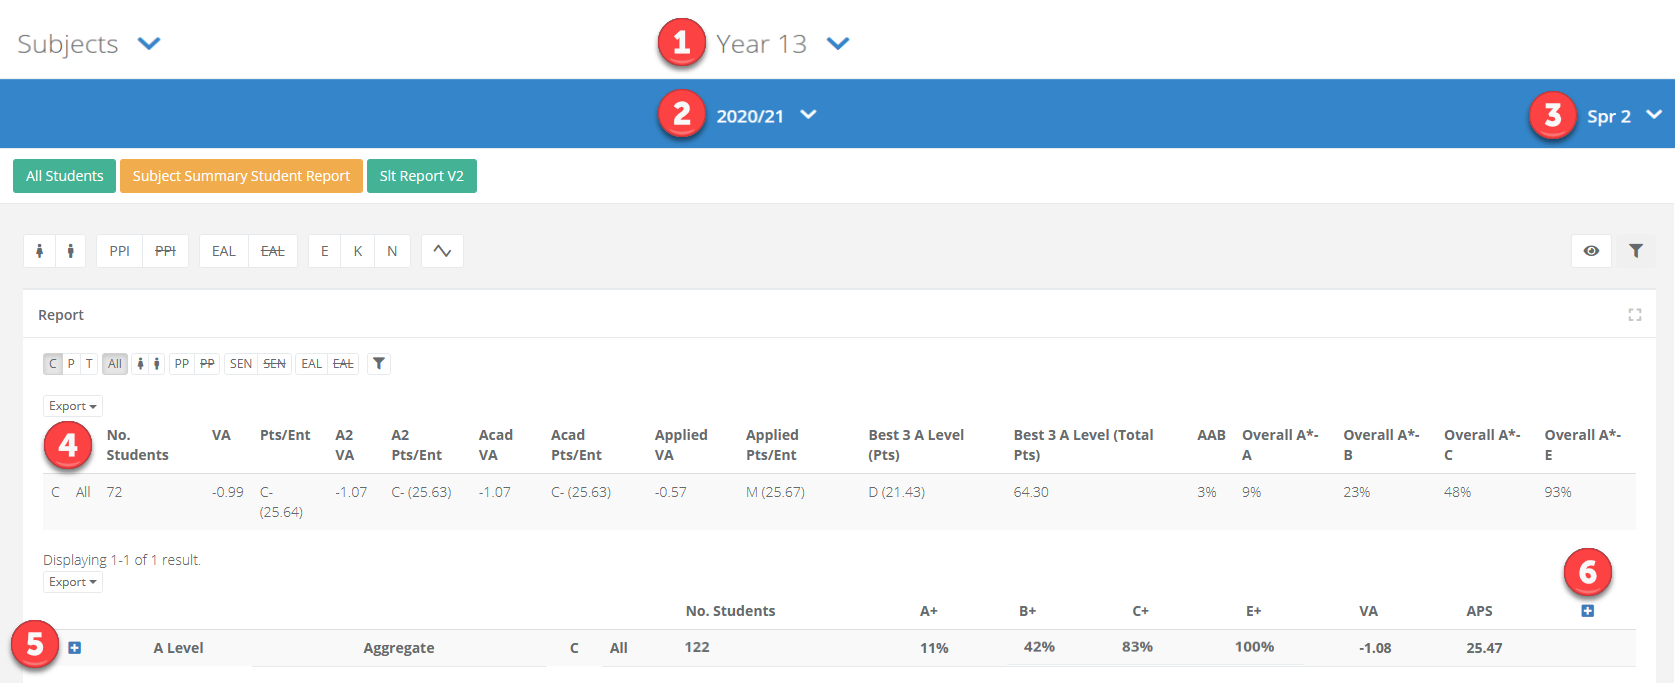
- Select Year Groups from the menu and select the year group that you want to look at. You will be taken into the Subject Summary Report for that year group.

| Area | Description |
|---|---|
| 1 | The year group. |
| 2 | The academic year. |
| 3 | The assessment term. |
| 4 | The headline metrics. |
| 5 | The plus icon here can be selected to show all subjects and the percentages of students at each grade threshold. |
| 6 | The plus icon here can be selected to show the percentages of students at each grade. |
Hovering your cursor over a percentage will show the number of students that are contributing to it.

How to filter and compare data
The line directly above the table contains icons representing attainment types (C means Current, P means Predicted), as well as key student groups such as gender, Pupil Premium, and SEN. You can select the icons and then press the filter icon to see this data side-by-side.

You can also filter the page using the options at the top. Selecting the eye icon will display additional filters. Once you have made your selection, click the blue filter icon to refresh the data.

Subject Summary Student Report
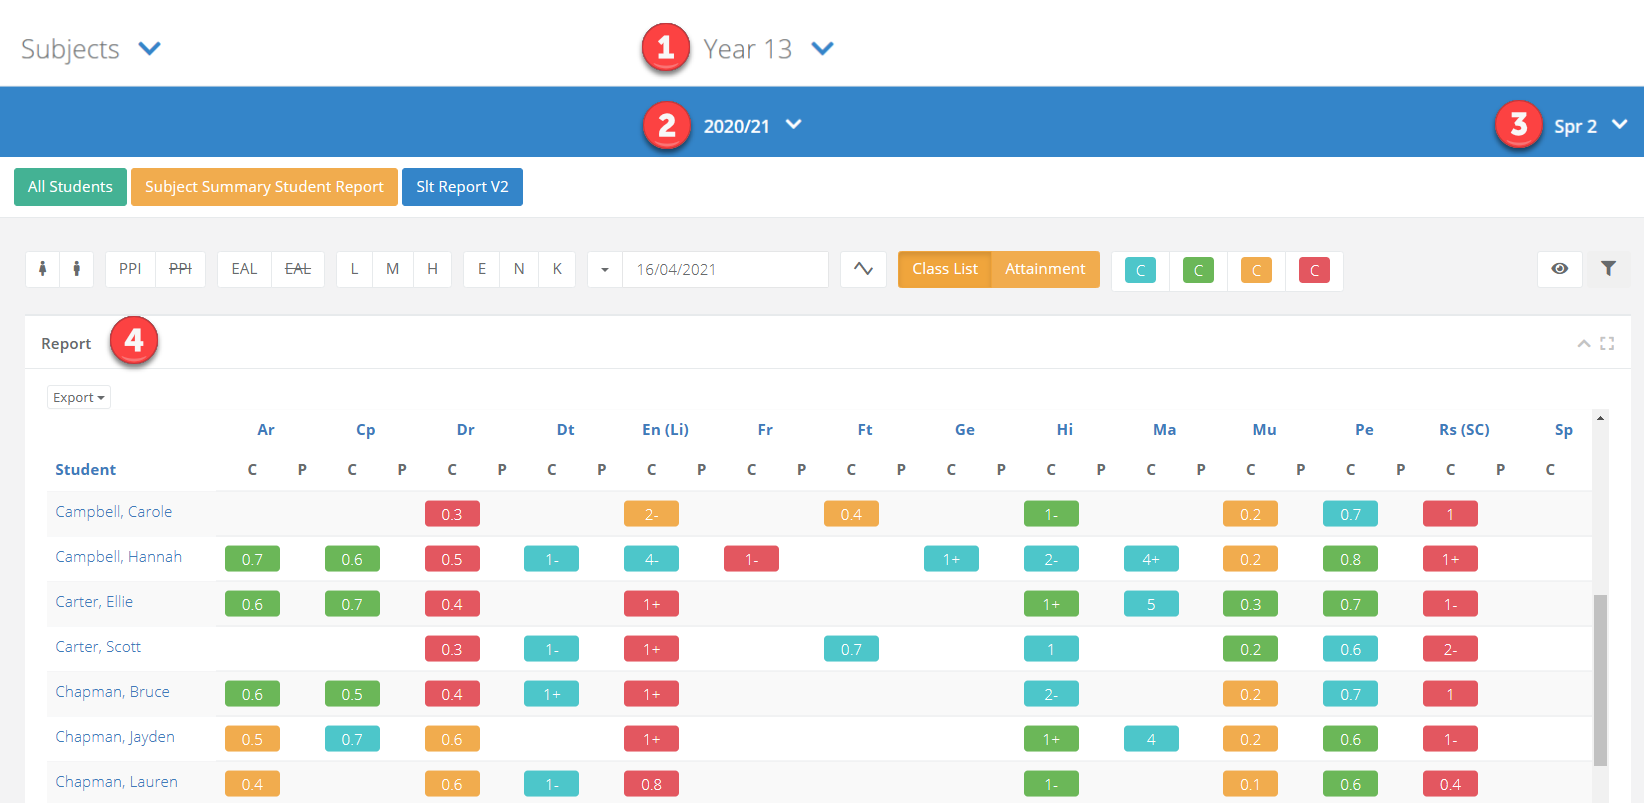
- Select Year Groups from the menu and select the year group that want to look at. You will be taken into the Subject Summary Report for that year group. Select the orange option for Subject Summary Student Report from the page.

| Area | Description |
|---|---|
| 1 | The year group. |
| 2 | The academic year. |
| 3 | The assessment term. |
| 4 | The data report showing students down the left. Each subject will display the current and predicted data side-by-side. |
How to filter and compare data
You can filter the page using the options at the top. Selecting the eye icon will display additional filters. Once you have made your selection, click the blue filter icon to refresh the data.


