- 1 Minute to read
- Print
- DarkLight
- PDF
Single view
- 1 Minute to read
- Print
- DarkLight
- PDF
The Single View page collates observation data and displays for each teacher, a weighted average for each observation strand, as well as an overall average.
This helps to identify the average performance of staff, as well as identifying key CPD requirements.
Video overview of the single view page
How to access single view
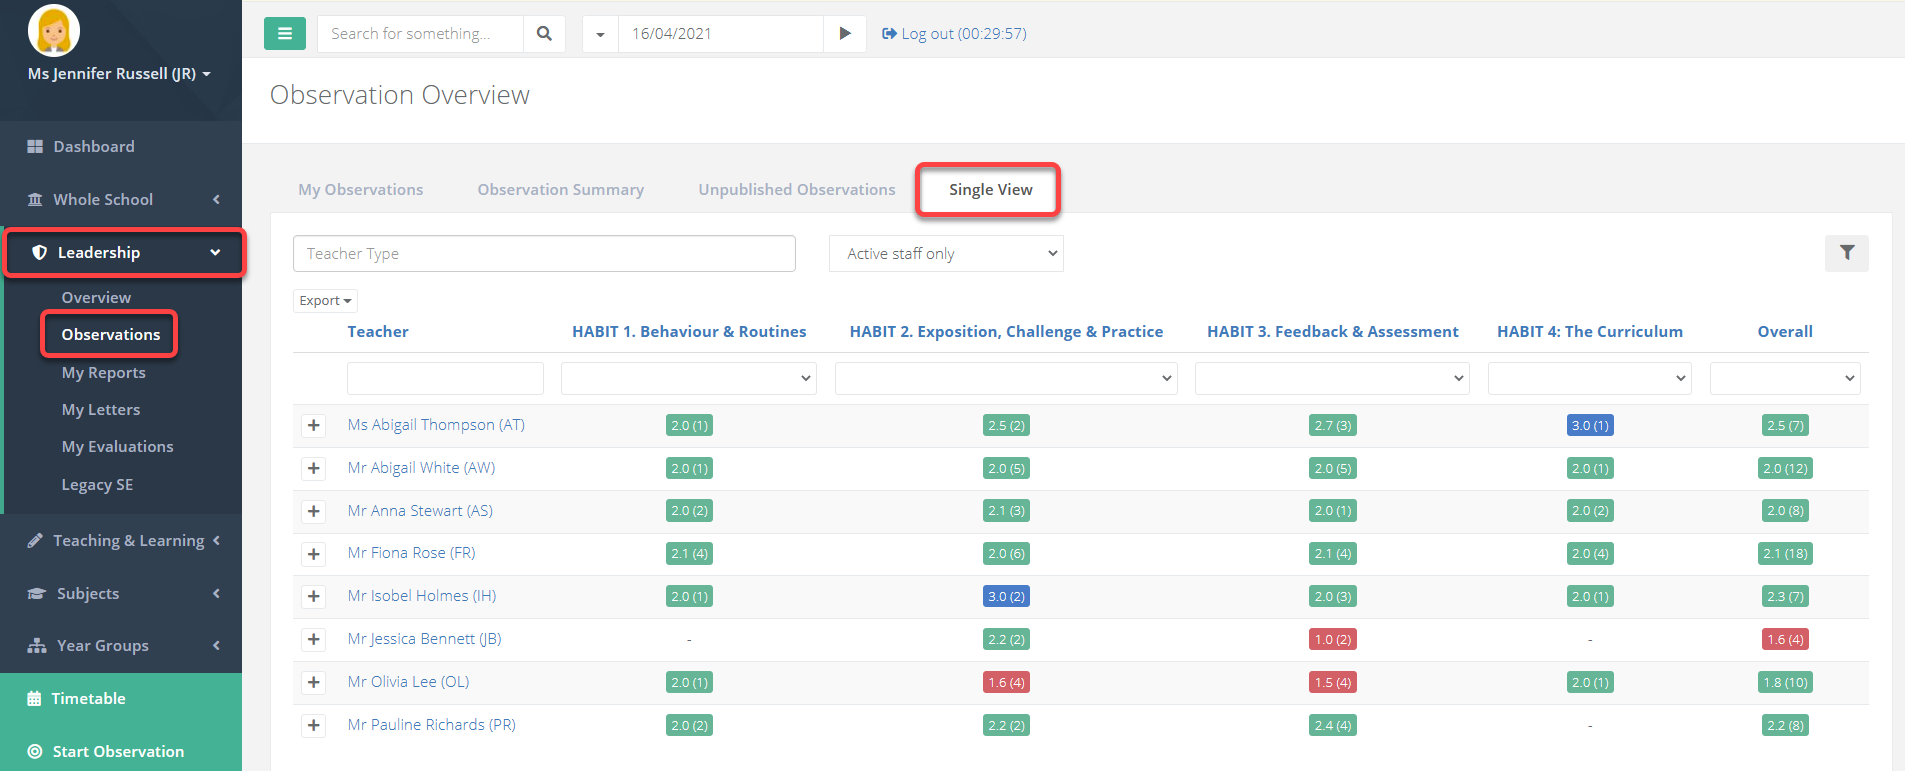
- Select Leadership > Observations from the menu. Select the tab Single View. You will see each of your observation strands as different columns, as well as an overall column.
Understanding the single view page
Within each column you will see a weighted average grade for the member of staff. The number is the average value. The number in the brackets shows how many observations are contributing to that average.
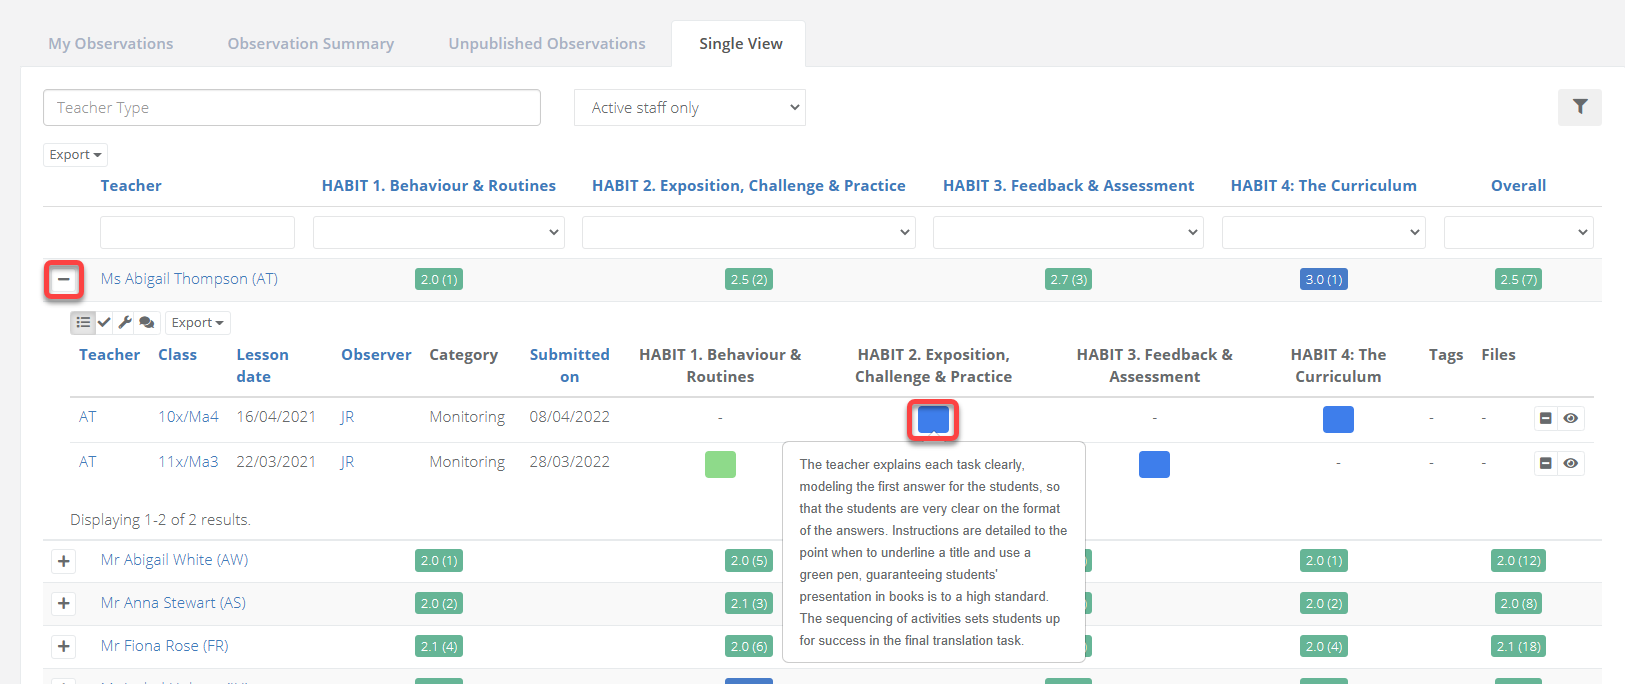
Selecting the plus icon next to a member of staff will show the observations and grades that contribute to the average. You can select the individual grades therein to read the feedback.
There are several ways to sort and filter the data to help you access the analysis you want.
Columns can be sorted by selecting the column heading.
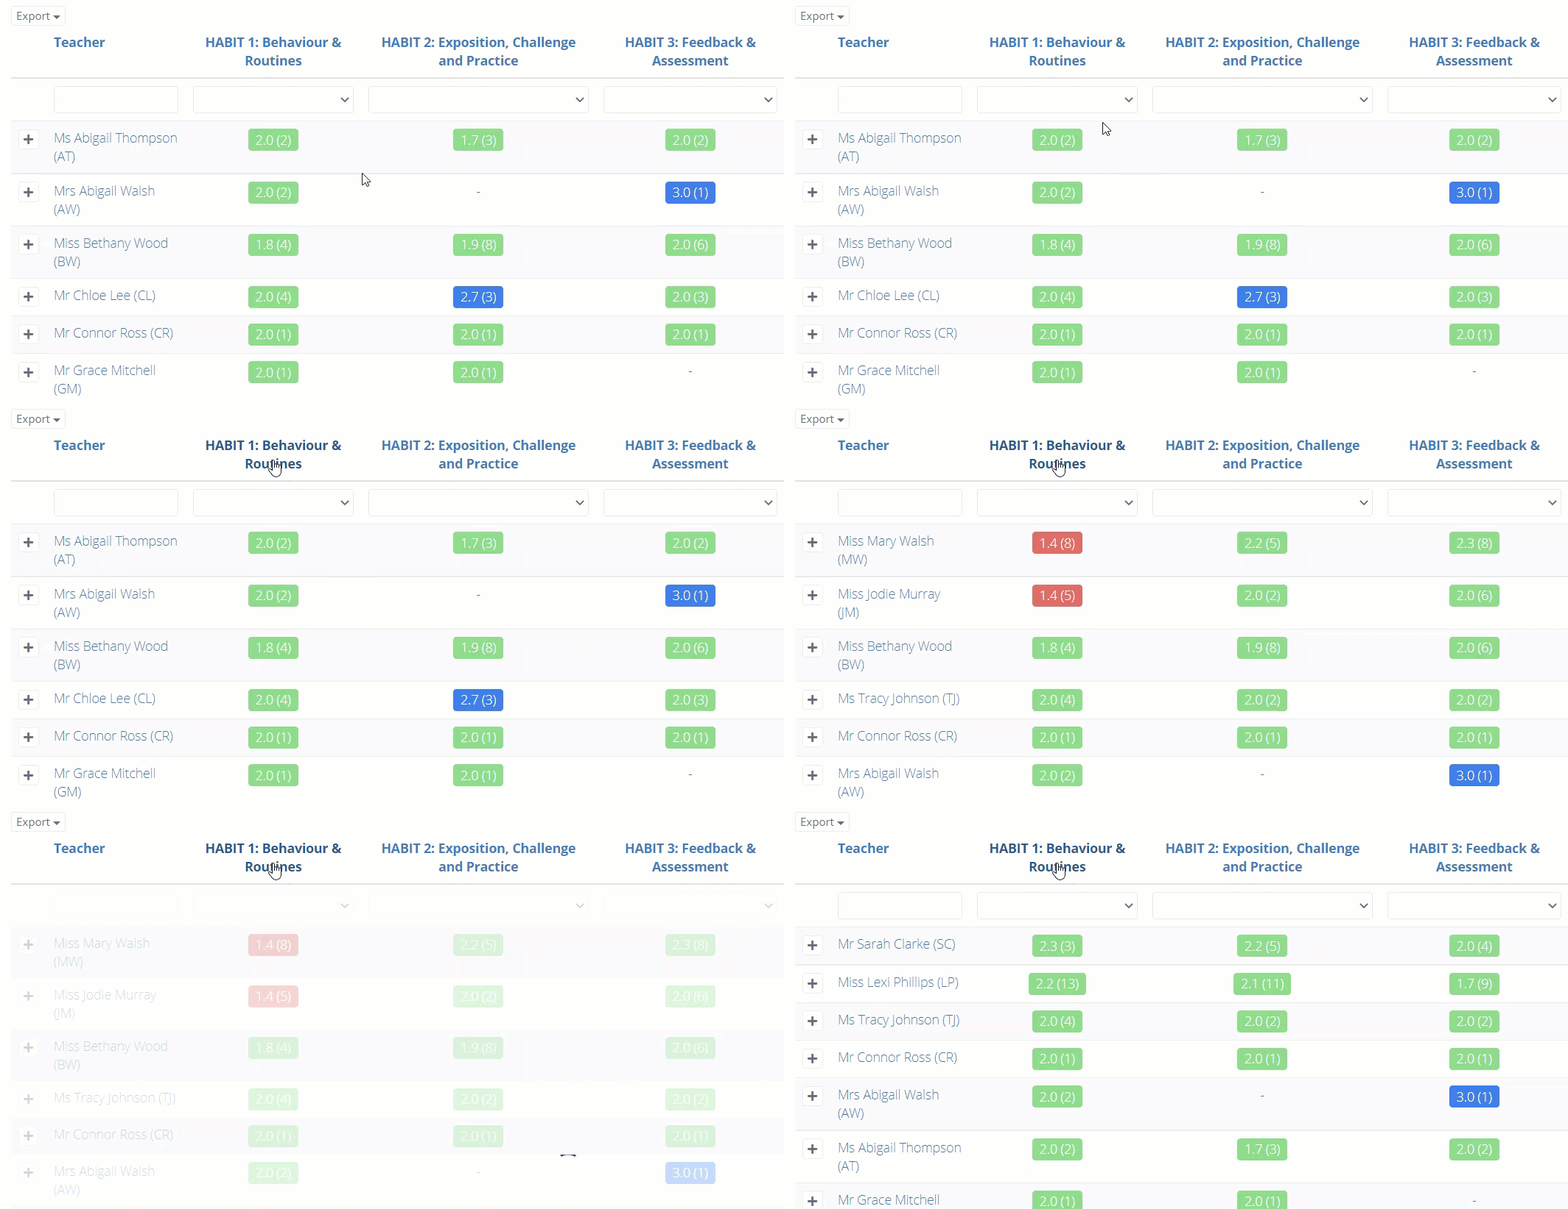
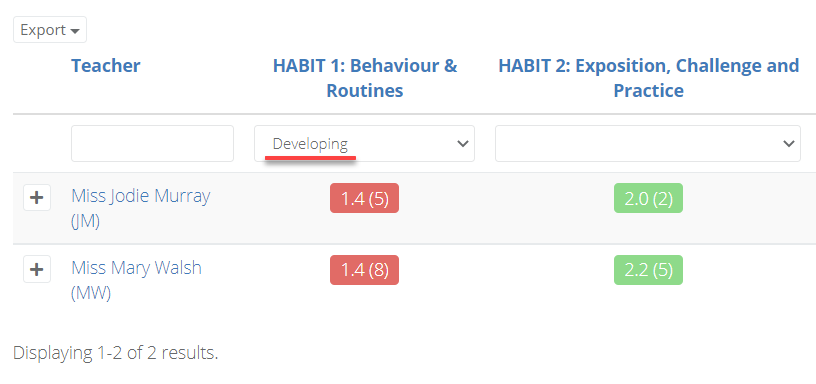
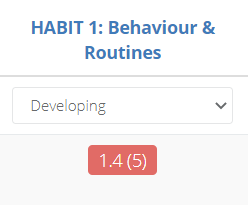
Strands can be filtered to identify teachers performing at certain levels.
