- 4 Minutes to read
- Print
- DarkLight
- PDF
28/09/22 - Updating Progress 8 Scores
- 4 Minutes to read
- Print
- DarkLight
- PDF
This article walks through:
An overview of the updates to Progress 8
The ProgressTeaching platform has been updated in line with the 2021/22 unvalidated Progress 8 calculations. The DfE’s technical guide is available here.
The updates are:
- Progress 8 calculations now use scaled scores (see table 1 below)
- There is a minimum Progress 8 value for each KS2 average score (see table 2 below)
- The definitions for L/M/H have been defined as:
- L: less than 100
- M: greater than or equal to 100 & less than 110
- H: greater than or equal to 110
- Scaled score values assigned to students below the level of the maths and reading tests (see table 3 below).
How to update your school's Progress 8 score
In order to update your school’s Progress 8 score so that it is aligned with the 2021/22 unvalidated Progress 8 calculations, please do the following:
- Review and update your students’ KS2 average scaled scores
- Recalculate the data
- Access the admin area
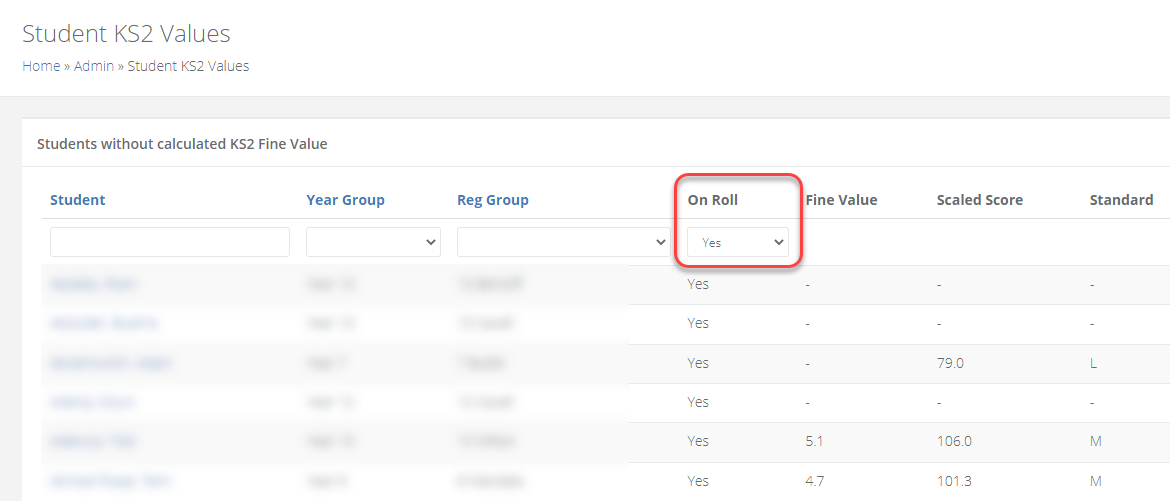
- Select Progress > Student KS2 Values
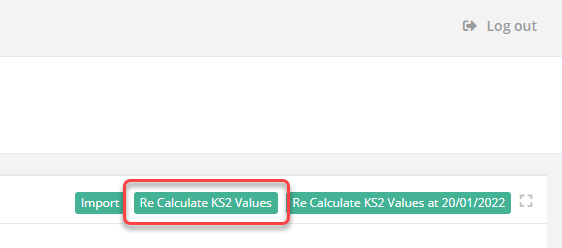
- Select 'Recalculate KS2 Values'

- Refresh the GCSE assessment term
- Access the admin area
- Select Assessment terms
- Filter for the 2021/22 GCSE assessment term
- Select the refresh icon

An on/off roll filter has been added to provide access to previous year groups.

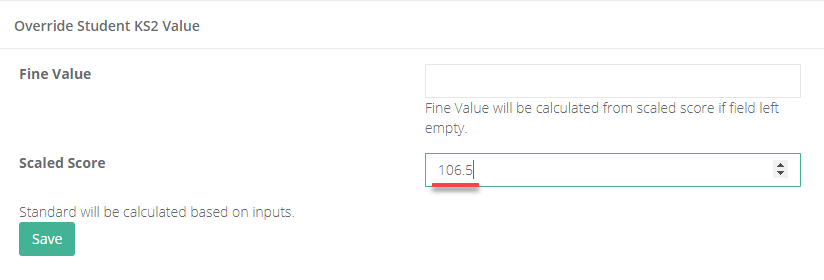
KS2 average scaled scores can be overridden on a student-by-student basis. This feature can be used to update a handful of students, rather than exporting & importing the data.

e.g. If a student has a group 21 score (see table 1 below), you can use any value between 106.5 & 107 to assign them to group 21.

If a student does not have a KS2 average, the override feature can still be used by first giving the pupil an estimate KS2 score.
When entering KS2 data for any students that are unable to access the reading and/or maths tests, it is possible to enter either the grade or the value assigned to that grade (see table 3 below). For example, a pupil can have either an N or the value 79 entered as their scaled score.
Table 1: Estimated Attainment 8 scores
| KS2 prior attainment group | KS2 average scaled score range | Attainment 8 average | English average | Maths average | EBacc average | Open average |
|---|---|---|---|---|---|---|
| 1 | 59 to 82 | 18.47 | 4.37 | 2.6 | 5.15 | 6.36 |
| 2 | 82.5 to 86 | 19.8 | 4.9 | 2.74 | 5.21 | 6.96 |
| 3 | 86.5 to 87.5 | 22.66 | 5.5 | 3.43 | 6.02 | 7.71 |
| 4 | 88 to 89 | 24.26 | 5.82 | 3.83 | 6.48 | 8.14 |
| 5 | 89.5 to 90.5 | 26.14 | 6.24 | 4.27 | 6.98 | 8.66 |
| 6 | 91 to 92 | 27.76 | 6.57 | 4.67 | 7.44 | 9.08 |
| 7 | 92.5 to 93 | 29.39 | 6.86 | 5.02 | 7.9 | 9.6 |
| 8 | 93.5 to 94 | 30.85 | 7.19 | 5.41 | 8.31 | 9.94 |
| 9 | 94.5 to 95 | 32.35 | 7.47 | 5.79 | 8.76 | 10.34 |
| 10 | 95.5 to 96 | 33.74 | 7.75 | 6.11 | 9.16 | 10.72 |
| 11 | 96.5 to 97 | 35.21 | 8.01 | 6.46 | 9.62 | 11.11 |
| 12 | 97.5 to 98 | 37.01 | 8.38 | 6.88 | 10.16 | 11.59 |
| 13 | 98.5 to 99 | 38.58 | 8.67 | 7.25 | 10.64 | 12.03 |
| 14 | 99.5 to 100 | 40.21 | 8.97 | 7.62 | 11.14 | 12.47 |
| 15 | 100.5 to 101 | 41.9 | 9.31 | 7.96 | 11.69 | 12.94 |
| 16 | 101.5 to 102 | 43.56 | 9.6 | 8.34 | 12.23 | 13.39 |
| 17 | 102.5 to 103 | 45.66 | 9.99 | 8.8 | 12.93 | 13.95 |
| 18 | 103.5 to 104 | 47.39 | 10.3 | 9.17 | 13.51 | 14.41 |
| 19 | 104.5 to 105 | 49.52 | 10.68 | 9.63 | 14.24 | 14.97 |
| 20 | 105.5 to 106 | 51.82 | 11.1 | 10.12 | 15.01 | 15.59 |
| 21 | 106.5 to 107 | 54.1 | 11.48 | 10.61 | 15.8 | 16.19 |
| 22 | 107.5 to 108 | 56.44 | 11.92 | 11.12 | 16.61 | 16.8 |
| 23 | 108.5 to 109 | 58.92 | 12.3 | 11.69 | 17.47 | 17.46 |
| 24 | 109.5 to 110 | 61.43 | 12.74 | 12.19 | 18.33 | 18.17 |
| 25 | 110.5 to 111 | 63.72 | 13.17 | 12.66 | 19.08 | 18.8 |
| 26 | 111.5 to 112 | 66.34 | 13.61 | 13.22 | 20.01 | 19.52 |
| 27 | 112.5 to 113 | 68.77 | 13.99 | 13.76 | 20.79 | 20.22 |
| 28 | 113.5 to 114 | 71.06 | 14.32 | 14.32 | 21.6 | 20.82 |
| 29 | 114.5 to 115 | 73.42 | 14.75 | 14.8 | 22.37 | 21.51 |
| 30 | 115.5 to 116 | 75.57 | 15.1 | 15.27 | 23.07 | 22.13 |
| 31 | 116.5 to 117 | 77.73 | 15.44 | 15.72 | 23.78 | 22.79 |
| 32 | 117.5 to 118 | 79.39 | 15.66 | 16.12 | 24.3 | 23.32 |
| 33 | 118.5 to 119 | 81.5 | 16.12 | 16.46 | 24.92 | 24 |
| 34 | 119.5 to 120 | 82.88 | 16.33 | 16.66 | 25.41 | 24.48 |
Table 2: Minimum Progress 8 values
| KS2 prior attainment group | KS2 average scaled score range | Minimum P8 Threshold |
|---|---|---|
| 1-14 | 59 to 100 | N/A |
| 15 | 100.5 to 101 | -4.188 |
| 16 | 101.5 to 102 | -4.238 |
| 17 | 102.5 to 103 | -4.239 |
| 18 | 103.5 to 104 | -4.311 |
| 19 | 104.5 to 105 | -4.338 |
| 20 | 105.5 to 106 | -4.365 |
| 21 | 106.5 to 107 | -4.404 |
| 22 | 107.5 to 108 | -4.380 |
| 23 | 108.5 to 109 | -4.365 |
| 24 | 109.5 to 110 | -4.299 |
| 25 | 110.5 to 111 | -4.226 |
| 26 | 111.5 to 112 | -4.136 |
| 27 | 112.5 to 113 | -4.003 |
| 28 | 113.5 to 114 | -3.933 |
| 29 | 114.5 to 115 | -3.721 |
| 30 | 115.5 to 116 | -3.557 |
| 31 | 116.5 to 117 | -3.380 |
| 32 | 117.5 to 118 | -3.207 |
| 33 | 118.5 to 119 | -3.113 |
| 34 | 119.5 to 120 | -2.627 |
Table 3: Scaled score values for pupils below the level of the maths and reading tests
| Grade | ProgressTeaching grades | Value used in KS2 average calculation |
|---|---|---|
| N | N | 79 |
| Pupils below the interim pre-Key Stage standard but not on P-scales (BLW) | BLW | 71 |
| Foundations for the expected standard (PKF) | PKF | 73 |
| Early development of the expected standard (PKE) | PKE | 76 |
| Growing development of the expected standard (PKG) | PKG | 79 |
| M, A, F, L, P, Q, S, T, U, W, X | M, A, F, L, P, Q, S, T, U, W, X | Disregard |
| P1i to P3ii (P1i, P1ii, P2i, P2ii, P3i & P3ii) | P1i, P1ii, P2i, P2ii, P3i & P3ii | 59 |
| P4 | P4 | 61 |
| P5 | P5 | 63 |
| P6 | P6 | 65 |
| P7 | P7 | 67 |
| P8 | P8 | 69 |

